Indonesian vs Spaniard Disability Age 65 to 74
COMPARE
Indonesian
Spaniard
Disability Age 65 to 74
Disability Age 65 to 74 Comparison
Indonesians
Spaniards
24.9%
DISABILITY AGE 65 TO 74
1.1/ 100
METRIC RATING
247th/ 347
METRIC RANK
24.6%
DISABILITY AGE 65 TO 74
2.4/ 100
METRIC RATING
240th/ 347
METRIC RANK
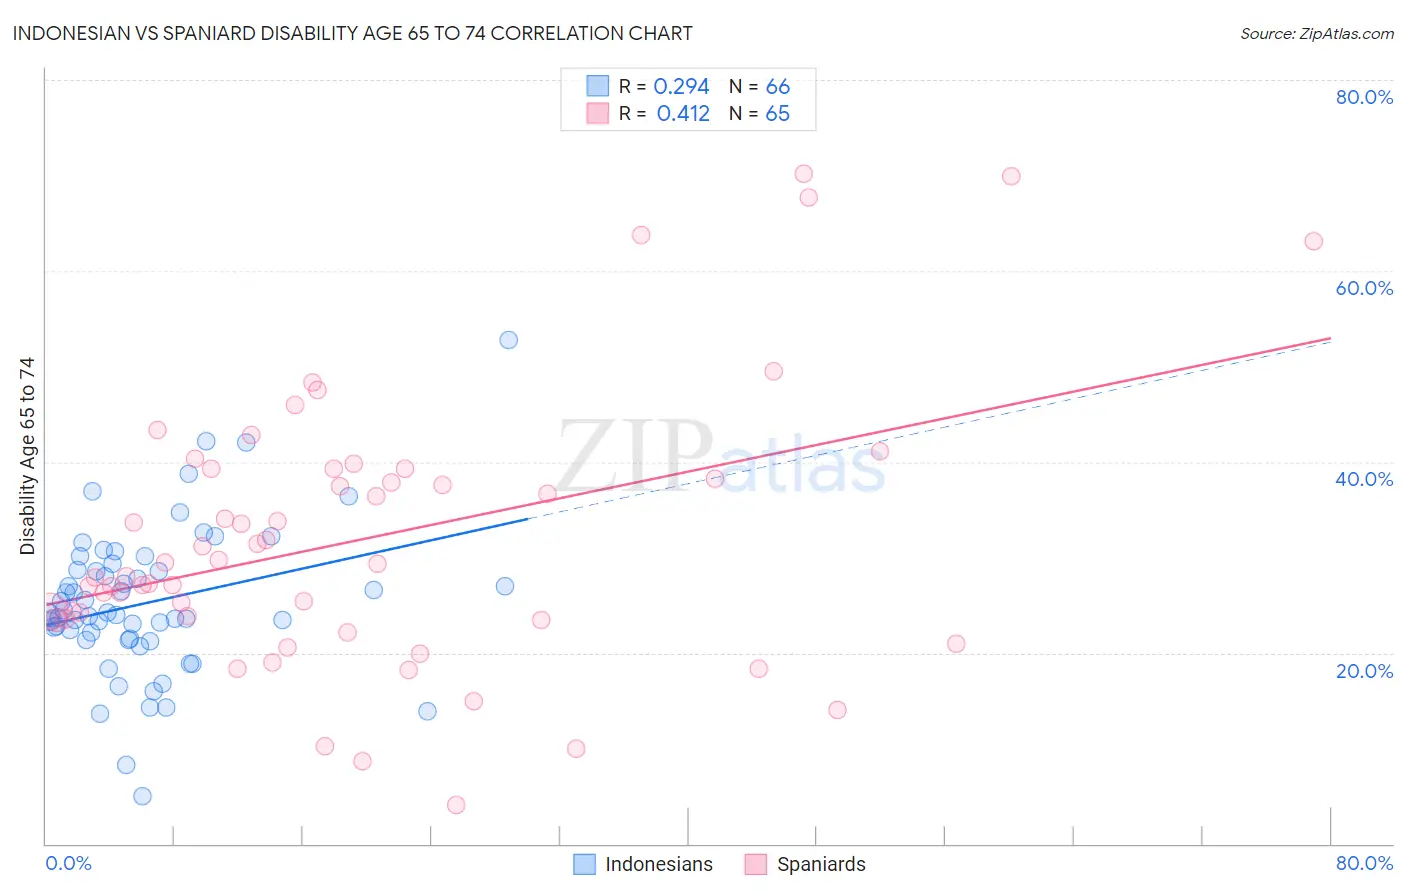
Indonesian vs Spaniard Disability Age 65 to 74 Correlation Chart
The statistical analysis conducted on geographies consisting of 162,466,289 people shows a weak positive correlation between the proportion of Indonesians and percentage of population with a disability between the ages 65 and 75 in the United States with a correlation coefficient (R) of 0.294 and weighted average of 24.9%. Similarly, the statistical analysis conducted on geographies consisting of 442,368,697 people shows a moderate positive correlation between the proportion of Spaniards and percentage of population with a disability between the ages 65 and 75 in the United States with a correlation coefficient (R) of 0.412 and weighted average of 24.6%, a difference of 1.2%.
Disability Age 65 to 74 Correlation Summary
| Measurement | Indonesian | Spaniard |
| Minimum | 5.0% | 4.0% |
| Maximum | 52.8% | 70.1% |
| Range | 47.8% | 66.1% |
| Mean | 25.3% | 31.9% |
| Median | 23.9% | 29.3% |
| Interquartile 25% (IQ1) | 21.5% | 23.5% |
| Interquartile 75% (IQ3) | 28.6% | 39.3% |
| Interquartile Range (IQR) | 7.1% | 15.8% |
| Standard Deviation (Sample) | 7.8% | 14.2% |
| Standard Deviation (Population) | 7.7% | 14.1% |
Demographics Similar to Indonesians and Spaniards by Disability Age 65 to 74
In terms of disability age 65 to 74, the demographic groups most similar to Indonesians are Senegalese (24.9%, a difference of 0.25%), Immigrants from Fiji (25.0%, a difference of 0.36%), Salvadoran (25.0%, a difference of 0.37%), Nonimmigrants (25.0%, a difference of 0.57%), and Immigrants from El Salvador (25.1%, a difference of 0.77%). Similarly, the demographic groups most similar to Spaniards are Immigrants from Western Africa (24.6%, a difference of 0.080%), Immigrants from Caribbean (24.6%, a difference of 0.090%), Immigrants from Senegal (24.6%, a difference of 0.16%), Spanish (24.6%, a difference of 0.18%), and Armenian (24.7%, a difference of 0.30%).
| Demographics | Rating | Rank | Disability Age 65 to 74 |
| Bahamians | 4.5 /100 | #233 | Tragic 24.4% |
| Panamanians | 4.2 /100 | #234 | Tragic 24.4% |
| Scotch-Irish | 3.8 /100 | #235 | Tragic 24.4% |
| German Russians | 3.7 /100 | #236 | Tragic 24.4% |
| West Indians | 3.4 /100 | #237 | Tragic 24.5% |
| Immigrants | Ghana | 3.0 /100 | #238 | Tragic 24.5% |
| Immigrants | Caribbean | 2.6 /100 | #239 | Tragic 24.6% |
| Spaniards | 2.4 /100 | #240 | Tragic 24.6% |
| Immigrants | Western Africa | 2.3 /100 | #241 | Tragic 24.6% |
| Immigrants | Senegal | 2.2 /100 | #242 | Tragic 24.6% |
| Spanish | 2.2 /100 | #243 | Tragic 24.6% |
| Armenians | 2.0 /100 | #244 | Tragic 24.7% |
| British West Indians | 2.0 /100 | #245 | Tragic 24.7% |
| Immigrants | Iraq | 1.9 /100 | #246 | Tragic 24.7% |
| Indonesians | 1.1 /100 | #247 | Tragic 24.9% |
| Senegalese | 0.9 /100 | #248 | Tragic 24.9% |
| Immigrants | Fiji | 0.8 /100 | #249 | Tragic 25.0% |
| Salvadorans | 0.8 /100 | #250 | Tragic 25.0% |
| Immigrants | Nonimmigrants | 0.7 /100 | #251 | Tragic 25.0% |
| Immigrants | El Salvador | 0.6 /100 | #252 | Tragic 25.1% |
| Sub-Saharan Africans | 0.6 /100 | #253 | Tragic 25.1% |