Indonesian vs Guyanese Disability Age 18 to 34
COMPARE
Indonesian
Guyanese
Disability Age 18 to 34
Disability Age 18 to 34 Comparison
Indonesians
Guyanese
7.2%
DISABILITY AGE 18 TO 34
0.4/ 100
METRIC RATING
254th/ 347
METRIC RANK
5.5%
DISABILITY AGE 18 TO 34
100.0/ 100
METRIC RATING
9th/ 347
METRIC RANK
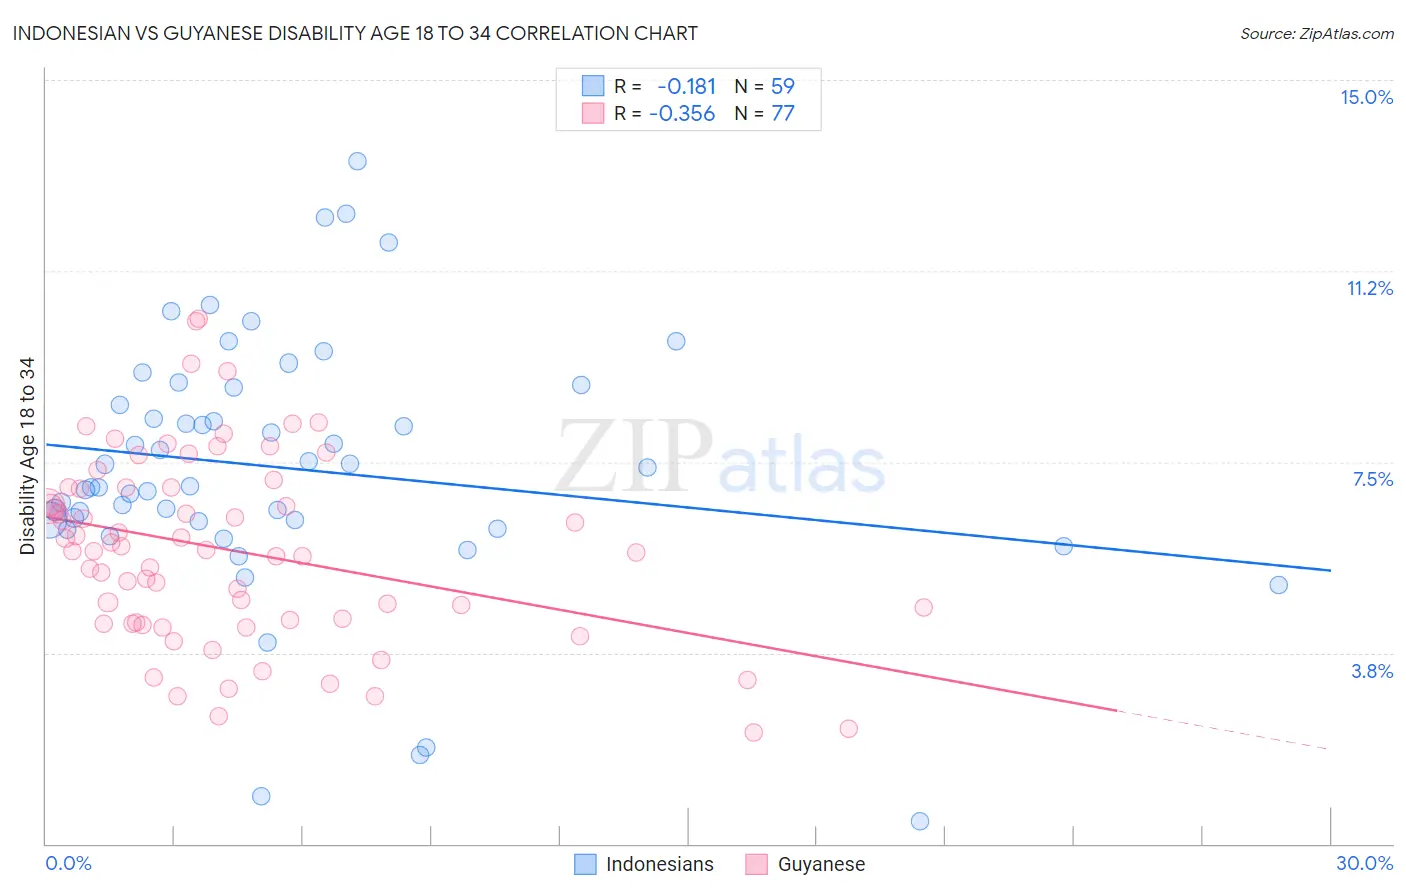
Indonesian vs Guyanese Disability Age 18 to 34 Correlation Chart
The statistical analysis conducted on geographies consisting of 162,691,406 people shows a poor negative correlation between the proportion of Indonesians and percentage of population with a disability between the ages 18 and 35 in the United States with a correlation coefficient (R) of -0.181 and weighted average of 7.2%. Similarly, the statistical analysis conducted on geographies consisting of 176,786,761 people shows a mild negative correlation between the proportion of Guyanese and percentage of population with a disability between the ages 18 and 35 in the United States with a correlation coefficient (R) of -0.356 and weighted average of 5.5%, a difference of 31.2%.
Disability Age 18 to 34 Correlation Summary
| Measurement | Indonesian | Guyanese |
| Minimum | 0.44% | 2.2% |
| Maximum | 13.4% | 10.3% |
| Range | 13.0% | 8.1% |
| Mean | 7.4% | 5.8% |
| Median | 7.0% | 5.8% |
| Interquartile 25% (IQ1) | 6.3% | 4.3% |
| Interquartile 75% (IQ3) | 9.0% | 7.0% |
| Interquartile Range (IQR) | 2.6% | 2.6% |
| Standard Deviation (Sample) | 2.5% | 1.8% |
| Standard Deviation (Population) | 2.5% | 1.8% |
Similar Demographics by Disability Age 18 to 34
Demographics Similar to Indonesians by Disability Age 18 to 34
In terms of disability age 18 to 34, the demographic groups most similar to Indonesians are Immigrants from Germany (7.2%, a difference of 0.020%), Immigrants from Laos (7.2%, a difference of 0.050%), Croatian (7.2%, a difference of 0.29%), Czech (7.2%, a difference of 0.32%), and Polish (7.2%, a difference of 0.55%).
| Demographics | Rating | Rank | Disability Age 18 to 34 |
| Yugoslavians | 0.8 /100 | #247 | Tragic 7.2% |
| Guamanians/Chamorros | 0.8 /100 | #248 | Tragic 7.2% |
| Malaysians | 0.7 /100 | #249 | Tragic 7.2% |
| Fijians | 0.6 /100 | #250 | Tragic 7.2% |
| Spaniards | 0.6 /100 | #251 | Tragic 7.2% |
| Poles | 0.6 /100 | #252 | Tragic 7.2% |
| Croatians | 0.5 /100 | #253 | Tragic 7.2% |
| Indonesians | 0.4 /100 | #254 | Tragic 7.2% |
| Immigrants | Germany | 0.4 /100 | #255 | Tragic 7.2% |
| Immigrants | Laos | 0.4 /100 | #256 | Tragic 7.2% |
| Czechs | 0.3 /100 | #257 | Tragic 7.2% |
| Immigrants | Micronesia | 0.3 /100 | #258 | Tragic 7.3% |
| Somalis | 0.2 /100 | #259 | Tragic 7.3% |
| Tohono O'odham | 0.2 /100 | #260 | Tragic 7.3% |
| Northern Europeans | 0.2 /100 | #261 | Tragic 7.3% |
Demographics Similar to Guyanese by Disability Age 18 to 34
In terms of disability age 18 to 34, the demographic groups most similar to Guyanese are Immigrants from Uzbekistan (5.5%, a difference of 0.15%), Vietnamese (5.5%, a difference of 0.22%), Immigrants from St. Vincent and the Grenadines (5.5%, a difference of 0.28%), Immigrants from Guyana (5.5%, a difference of 0.50%), and Immigrants from Iran (5.5%, a difference of 0.60%).
| Demographics | Rating | Rank | Disability Age 18 to 34 |
| Immigrants | Hong Kong | 100.0 /100 | #2 | Exceptional 5.2% |
| Immigrants | Grenada | 100.0 /100 | #3 | Exceptional 5.3% |
| Immigrants | Cuba | 100.0 /100 | #4 | Exceptional 5.4% |
| Immigrants | Taiwan | 100.0 /100 | #5 | Exceptional 5.4% |
| Filipinos | 100.0 /100 | #6 | Exceptional 5.4% |
| Immigrants | China | 100.0 /100 | #7 | Exceptional 5.4% |
| Immigrants | Guyana | 100.0 /100 | #8 | Exceptional 5.5% |
| Guyanese | 100.0 /100 | #9 | Exceptional 5.5% |
| Immigrants | Uzbekistan | 100.0 /100 | #10 | Exceptional 5.5% |
| Vietnamese | 100.0 /100 | #11 | Exceptional 5.5% |
| Immigrants | St. Vincent and the Grenadines | 100.0 /100 | #12 | Exceptional 5.5% |
| Immigrants | Iran | 100.0 /100 | #13 | Exceptional 5.5% |
| Indians (Asian) | 100.0 /100 | #14 | Exceptional 5.5% |
| Immigrants | India | 100.0 /100 | #15 | Exceptional 5.6% |
| Immigrants | Israel | 100.0 /100 | #16 | Exceptional 5.6% |