Immigrants from Yemen vs Immigrants from Scotland Disability Age Over 75

COMPARE

Immigrants from Yemen
Race
Ancestry
AfghanAfricanAlaska NativeAlaskan AthabascanAlbanianAleutAlsatianAmericanApacheArabArapahoArgentineanArmenianAssyrian/Chaldean/SyriacAustralianAustrianBahamianBangladeshiBarbadianBasqueBelgianBelizeanBermudanBhutaneseBlackfeetBolivianBrazilianBritishBritish West IndianBulgarianBurmeseCajunCambodianCanadianCape VerdeanCarpatho RusynCelticCentral AmericanCentral American IndianCherokeeCheyenneChickasawChileanChineseChippewaChoctawColombianColvilleComancheCosta RicanCreeCreekCroatianCrowCubanCypriotCzechCzechoslovakianDanishDelawareDominicanDutchDutch West IndianEastern EuropeanEcuadorianEgyptianEnglishEstonianEthiopianEuropeanFijianFilipinoFinnishFrenchFrench American IndianFrench CanadianGermanGerman RussianGhanaianGreekGuamanian/ChamorroGuatemalanGuyaneseHaitianHmongHonduranHopiHoumaHungarianIcelanderIndian (Asian)IndonesianInupiatIranianIraqiIrishIroquoisIsraeliItalianJamaicanJapaneseJordanianKenyanKiowaKoreanLaotianLatvianLebaneseLiberianLithuanianLumbeeLuxembourgerMacedonianMalaysianMalteseMarshalleseMenomineeMexicanMexican American IndianMongolianMoroccanNative HawaiianNavajoNepaleseNew ZealanderNicaraguanNigerianNorthern EuropeanNorwegianOkinawanOsageOttawaPaiutePakistaniPalestinianPanamanianParaguayanPennsylvania GermanPeruvianPimaPolishPortuguesePotawatomiPuebloPuerto RicanPuget Sound SalishRomanianRussianSalvadoranSamoanScandinavianScotch-IrishScottishSeminoleSenegaleseSerbianShoshoneSierra LeoneanSiouxSlavicSlovakSloveneSomaliSouth AfricanSouth AmericanSouth American IndianSoviet UnionSpaniardSpanishSpanish AmericanSpanish American IndianSri LankanSubsaharan AfricanSudaneseSwedishSwissSyrianTaiwaneseThaiTlingit-HaidaTohono O'OdhamTonganTrinidadian and TobagonianTsimshianTurkishU.S. Virgin IslanderUgandanUkrainianUruguayanUteVenezuelanVietnameseWelshWest IndianYakamaYaquiYugoslavianYumanYup'ikZimbabwean
Immigration
NonimmigrantsImmigrantsAfghanistanAfricaAlbaniaArgentinaArmeniaAsiaAustraliaAustriaBahamasBangladeshBarbadosBelarusBelgiumBelizeBoliviaBosnia and HerzegovinaBrazilBulgariaBurma/MyanmarCabo VerdeCambodiaCameroonCanadaCaribbeanCentral AmericaChileChinaColombiaCongoCosta RicaCroatiaCubaCzechoslovakiaDenmarkDominicaDominican RepublicEastern AfricaEastern AsiaEastern EuropeEcuadorEgyptEl SalvadorEnglandEritreaEthiopiaEuropeFijiFranceGermanyGhanaGreeceGrenadaGuatemalaGuyanaHaitiHondurasHong KongHungaryIndiaIndonesiaIranIraqIrelandIsraelItalyJamaicaJapanJordanKazakhstanKenyaKoreaKuwaitLaosLatin AmericaLatviaLebanonLiberiaLithuaniaMalaysiaMexicoMicronesiaMiddle AfricaMoldovaMoroccoNepalNetherlandsNicaraguaNigeriaNorth AmericaNorth MacedoniaNorthern AfricaNorthern EuropeNorwayOceaniaPakistanPanamaPeruPhilippinesPolandPortugalRomaniaRussiaSaudi ArabiaSenegalSerbiaSierra LeoneSingaporeSomaliaSouth AfricaSouth AmericaSouth Central AsiaSouth Eastern AsiaSouthern EuropeSpainSri LankaSt. Vincent and the GrenadinesSudanSwedenSwitzerlandSyriaTaiwanThailandTrinidad and TobagoTurkeyUgandaUkraineUruguayUzbekistanVenezuelaVietnamWest IndiesWestern AfricaWestern AsiaWestern EuropeYemenZaireZimbabweAzores
Immigrants from Scotland
Race
Ancestry
AfghanAfricanAlaska NativeAlaskan AthabascanAlbanianAleutAlsatianAmericanApacheArabArapahoArgentineanArmenianAssyrian/Chaldean/SyriacAustralianAustrianBahamianBangladeshiBarbadianBasqueBelgianBelizeanBermudanBhutaneseBlackfeetBolivianBrazilianBritishBritish West IndianBulgarianBurmeseCajunCambodianCanadianCape VerdeanCarpatho RusynCelticCentral AmericanCentral American IndianCherokeeCheyenneChickasawChileanChineseChippewaChoctawColombianColvilleComancheCosta RicanCreeCreekCroatianCrowCubanCypriotCzechCzechoslovakianDanishDelawareDominicanDutchDutch West IndianEastern EuropeanEcuadorianEgyptianEnglishEstonianEthiopianEuropeanFijianFilipinoFinnishFrenchFrench American IndianFrench CanadianGermanGerman RussianGhanaianGreekGuamanian/ChamorroGuatemalanGuyaneseHaitianHmongHonduranHopiHoumaHungarianIcelanderIndian (Asian)IndonesianInupiatIranianIraqiIrishIroquoisIsraeliItalianJamaicanJapaneseJordanianKenyanKiowaKoreanLaotianLatvianLebaneseLiberianLithuanianLumbeeLuxembourgerMacedonianMalaysianMalteseMarshalleseMenomineeMexicanMexican American IndianMongolianMoroccanNative HawaiianNavajoNepaleseNew ZealanderNicaraguanNigerianNorthern EuropeanNorwegianOkinawanOsageOttawaPaiutePakistaniPalestinianPanamanianParaguayanPennsylvania GermanPeruvianPimaPolishPortuguesePotawatomiPuebloPuerto RicanPuget Sound SalishRomanianRussianSalvadoranSamoanScandinavianScotch-IrishScottishSeminoleSenegaleseSerbianShoshoneSierra LeoneanSiouxSlavicSlovakSloveneSomaliSouth AfricanSouth AmericanSouth American IndianSoviet UnionSpaniardSpanishSpanish AmericanSpanish American IndianSri LankanSubsaharan AfricanSudaneseSwedishSwissSyrianTaiwaneseThaiTlingit-HaidaTohono O'OdhamTonganTrinidadian and TobagonianTsimshianTurkishU.S. Virgin IslanderUgandanUkrainianUruguayanUteVenezuelanVietnameseWelshWest IndianYakamaYaquiYugoslavianYumanYup'ikZimbabwean
Immigration
NonimmigrantsImmigrantsAfghanistanAfricaAlbaniaArgentinaArmeniaAsiaAustraliaAustriaBahamasBangladeshBarbadosBelarusBelgiumBelizeBoliviaBosnia and HerzegovinaBrazilBulgariaBurma/MyanmarCabo VerdeCambodiaCameroonCanadaCaribbeanCentral AmericaChileChinaColombiaCongoCosta RicaCroatiaCubaCzechoslovakiaDenmarkDominicaDominican RepublicEastern AfricaEastern AsiaEastern EuropeEcuadorEgyptEl SalvadorEnglandEritreaEthiopiaEuropeFijiFranceGermanyGhanaGreeceGrenadaGuatemalaGuyanaHaitiHondurasHong KongHungaryIndiaIndonesiaIranIraqIrelandIsraelItalyJamaicaJapanJordanKazakhstanKenyaKoreaKuwaitLaosLatin AmericaLatviaLebanonLiberiaLithuaniaMalaysiaMexicoMicronesiaMiddle AfricaMoldovaMoroccoNepalNetherlandsNicaraguaNigeriaNorth AmericaNorth MacedoniaNorthern AfricaNorthern EuropeNorwayOceaniaPakistanPanamaPeruPhilippinesPolandPortugalRomaniaRussiaSaudi ArabiaScotlandSenegalSerbiaSierra LeoneSingaporeSomaliaSouth AfricaSouth AmericaSouth Central AsiaSouth Eastern AsiaSouthern EuropeSpainSri LankaSt. Vincent and the GrenadinesSudanSwedenSwitzerlandSyriaTaiwanThailandTrinidad and TobagoTurkeyUgandaUkraineUruguayUzbekistanVenezuelaVietnamWest IndiesWestern AfricaWestern AsiaWestern EuropeZaireZimbabweAzores
Disability Age Over 75
Income
Poverty
Unemployment
Labor Participation
Family Structure
Vehicle Availability
Education Level
Disability

Disability Age Over 75 Comparison

Immigrants from Yemen

Immigrants from Scotland

Tragic
Exceptional
52.0%
DISABILITY AGE OVER 75
0.0/ 100
METRIC RATING
323rd/ 347
METRIC RANK
45.1%
DISABILITY AGE OVER 75
100.0/ 100
METRIC RATING
14th/ 347
METRIC RANK

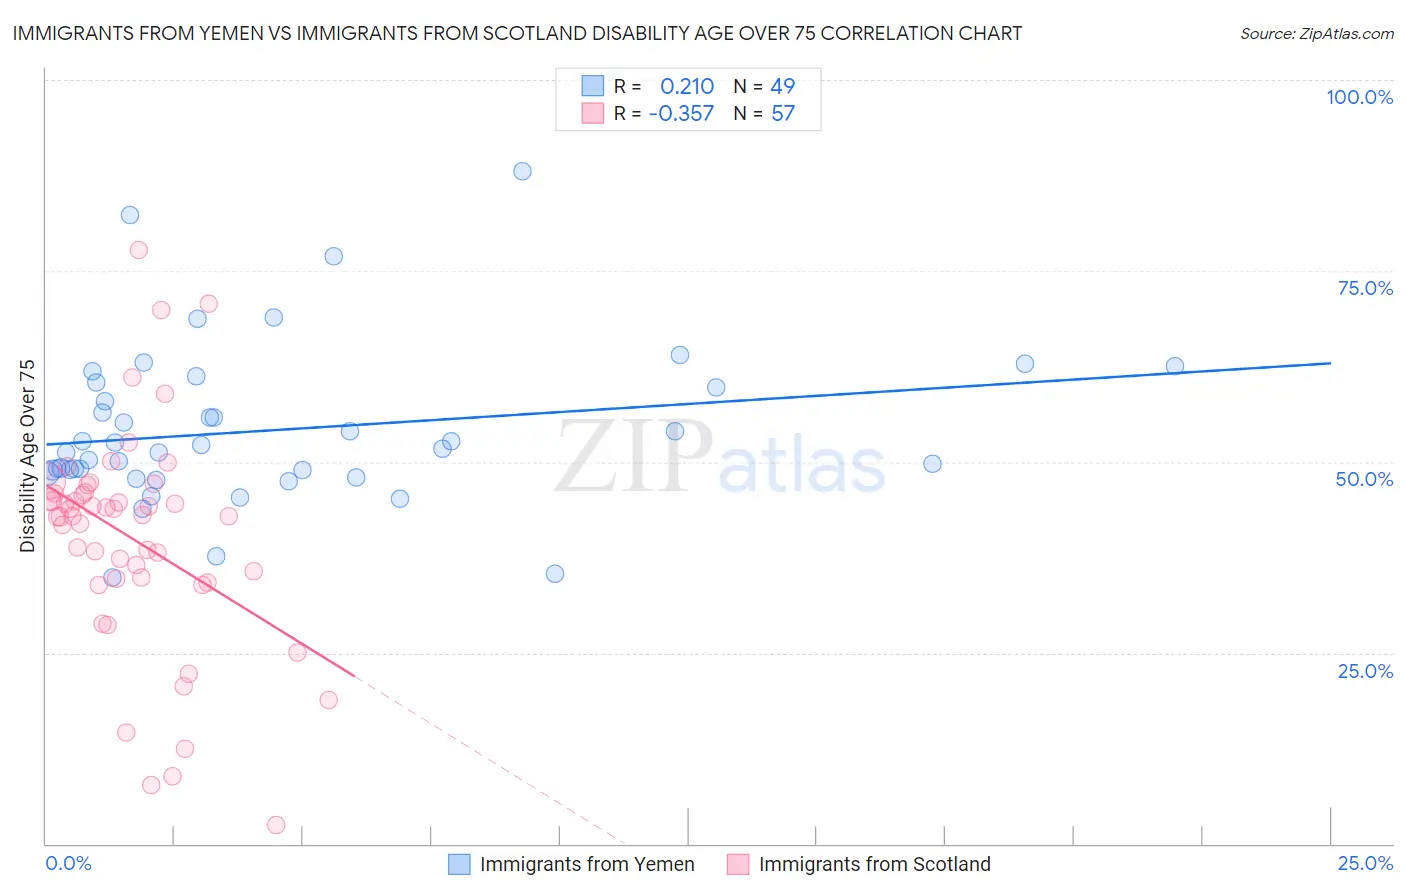
Immigrants from Yemen vs Immigrants from Scotland Disability Age Over 75 Correlation Chart

The statistical analysis conducted on geographies consisting of 82,401,520 people shows a weak positive correlation between the proportion of Immigrants from Yemen and percentage of population with a disability over the age of 75 in the United States with a correlation coefficient (R) of 0.210 and weighted average of 52.0%. Similarly, the statistical analysis conducted on geographies consisting of 196,341,463 people shows a mild negative correlation between the proportion of Immigrants from Scotland and percentage of population with a disability over the age of 75 in the United States with a correlation coefficient (R) of -0.357 and weighted average of 45.1%, a difference of 15.2%.
Immigrants from Yemen vs Immigrants from Scotland Disability Age Over 75

Disability Age Over 75 Correlation Summary

MeasurementImmigrants from YemenImmigrants from Scotland
Minimum34.8%2.5%
Maximum88.0%77.8%
Range53.2%75.3%
Mean54.2%40.0%
Median51.8%42.9%
Interquartile 25% (IQ1)48.7%34.5%
Interquartile 75% (IQ3)60.0%46.0%
Interquartile Range (IQR)11.3%11.5%
Standard Deviation (Sample)10.4%14.5%
Standard Deviation (Population)10.3%14.4%

Similar Demographics by Disability Age Over 75

Demographics Similar to Immigrants from Yemen by Disability Age Over 75

In terms of disability age over 75, the demographic groups most similar to Immigrants from Yemen are Comanche (51.7%, a difference of 0.52%), Menominee (52.3%, a difference of 0.63%), Immigrants from Cabo Verde (52.4%, a difference of 0.80%), Paiute (51.5%, a difference of 0.86%), and Dutch West Indian (51.5%, a difference of 0.86%).
DemographicsRating | RankDisability Age Over 75
Chickasaw
0.0
/100
|
#316
Tragic
51.2%
Yakama
0.0
/100
|
#317
Tragic
51.3%
Seminole
0.0
/100
|
#318
Tragic
51.5%
Creek
0.0
/100
|
#319
Tragic
51.5%
Paiute
0.0
/100
|
#320
Tragic
51.5%
Dutch West Indians
0.0
/100
|
#321
Tragic
51.5%
Comanche
0.0
/100
|
#322
Tragic
51.7%
Immigrants | Yemen
0.0
/100
|
#323
Tragic
52.0%
Menominee
0.0
/100
|
#324
Tragic
52.3%
Immigrants | Cabo Verde
0.0
/100
|
#325
Tragic
52.4%
Ute
0.0
/100
|
#326
Tragic
52.6%
Nepalese
0.0
/100
|
#327
Tragic
52.6%
Choctaw
0.0
/100
|
#328
Tragic
52.7%
Alaska Natives
0.0
/100
|
#329
Tragic
52.8%
Puerto Ricans
0.0
/100
|
#330
Tragic
52.9%

Demographics Similar to Immigrants from Scotland by Disability Age Over 75

In terms of disability age over 75, the demographic groups most similar to Immigrants from Scotland are Latvian (45.1%, a difference of 0.010%), Immigrants from Czechoslovakia (45.1%, a difference of 0.020%), Immigrants from Sweden (45.1%, a difference of 0.040%), Lithuanian (45.1%, a difference of 0.12%), and Immigrants from Northern Europe (45.2%, a difference of 0.14%).
DemographicsRating | RankDisability Age Over 75
Okinawans
100.0
/100
|
#7
Exceptional
44.9%
Immigrants | Austria
100.0
/100
|
#8
Exceptional
44.9%
Paraguayans
100.0
/100
|
#9
Exceptional
45.0%
Bulgarians
100.0
/100
|
#10
Exceptional
45.1%
Lithuanians
100.0
/100
|
#11
Exceptional
45.1%
Immigrants | Czechoslovakia
100.0
/100
|
#12
Exceptional
45.1%
Latvians
100.0
/100
|
#13
Exceptional
45.1%
Immigrants | Scotland
100.0
/100
|
#14
Exceptional
45.1%
Immigrants | Sweden
100.0
/100
|
#15
Exceptional
45.1%
Immigrants | Northern Europe
100.0
/100
|
#16
Exceptional
45.2%
Immigrants | India
100.0
/100
|
#17
Exceptional
45.2%
Bolivians
100.0
/100
|
#18
Exceptional
45.2%
Immigrants | Greece
100.0
/100
|
#19
Exceptional
45.2%
Immigrants | Serbia
100.0
/100
|
#20
Exceptional
45.3%
Immigrants | Belgium
100.0
/100
|
#21
Exceptional
45.3%