Immigrants from Western Europe vs Northern European Disability Age 35 to 64
COMPARE
Immigrants from Western Europe
Northern European
Disability Age 35 to 64
Disability Age 35 to 64 Comparison
Immigrants from Western Europe
Northern Europeans
11.1%
DISABILITY AGE 35 TO 64
65.2/ 100
METRIC RATING
165th/ 347
METRIC RANK
11.4%
DISABILITY AGE 35 TO 64
34.9/ 100
METRIC RATING
188th/ 347
METRIC RANK
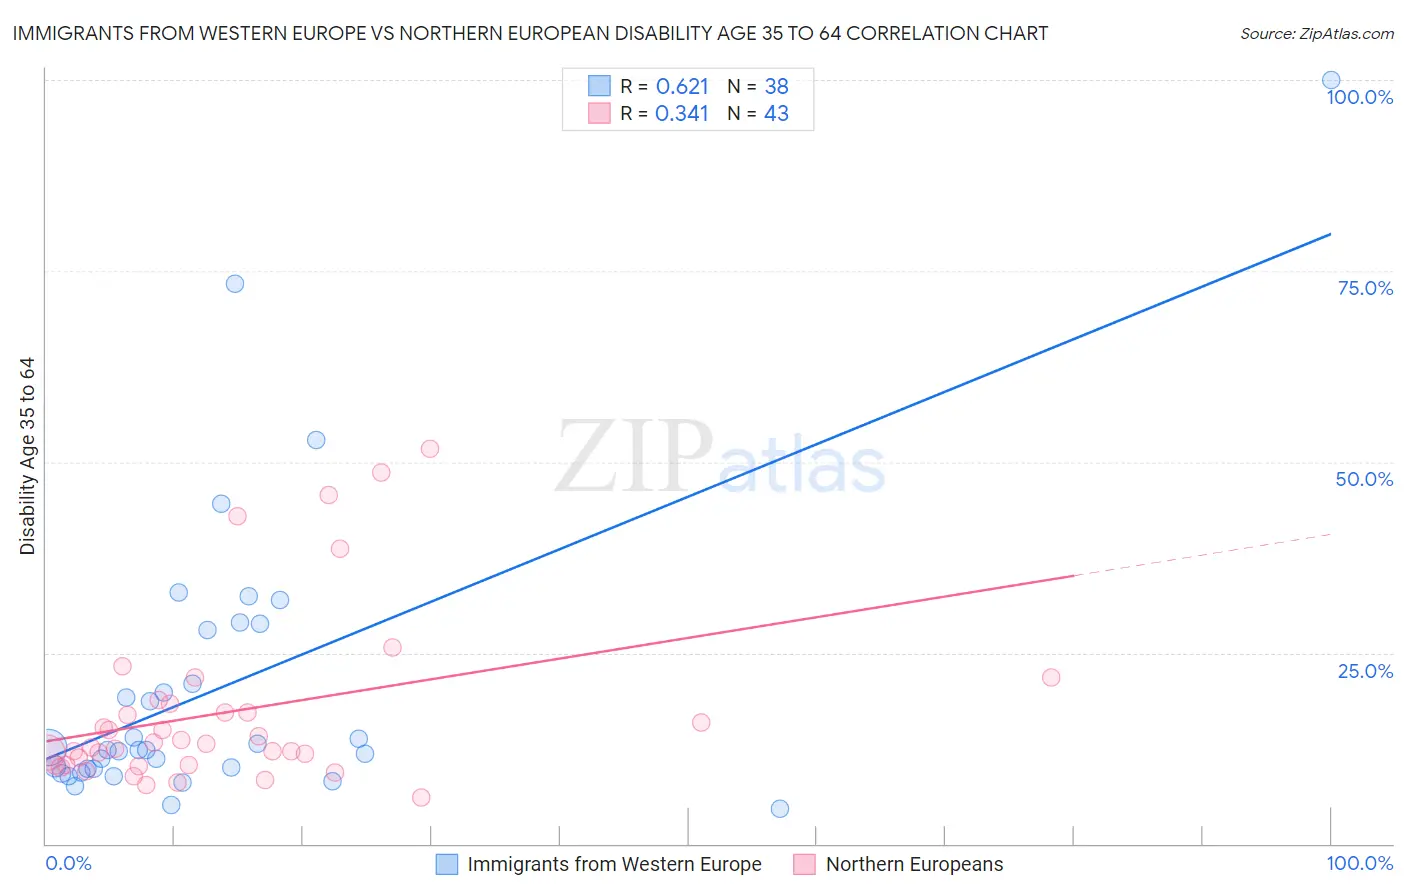
Immigrants from Western Europe vs Northern European Disability Age 35 to 64 Correlation Chart
The statistical analysis conducted on geographies consisting of 493,692,724 people shows a significant positive correlation between the proportion of Immigrants from Western Europe and percentage of population with a disability between the ages 34 and 64 in the United States with a correlation coefficient (R) of 0.621 and weighted average of 11.1%. Similarly, the statistical analysis conducted on geographies consisting of 405,868,631 people shows a mild positive correlation between the proportion of Northern Europeans and percentage of population with a disability between the ages 34 and 64 in the United States with a correlation coefficient (R) of 0.341 and weighted average of 11.4%, a difference of 2.5%.
Disability Age 35 to 64 Correlation Summary
| Measurement | Immigrants from Western Europe | Northern European |
| Minimum | 4.6% | 6.0% |
| Maximum | 100.0% | 51.8% |
| Range | 95.4% | 45.7% |
| Mean | 20.5% | 17.2% |
| Median | 12.3% | 13.1% |
| Interquartile 25% (IQ1) | 9.8% | 10.3% |
| Interquartile 75% (IQ3) | 27.9% | 18.3% |
| Interquartile Range (IQR) | 18.1% | 8.0% |
| Standard Deviation (Sample) | 19.5% | 11.3% |
| Standard Deviation (Population) | 19.2% | 11.2% |
Similar Demographics by Disability Age 35 to 64
Demographics Similar to Immigrants from Western Europe by Disability Age 35 to 64
In terms of disability age 35 to 64, the demographic groups most similar to Immigrants from Western Europe are Pakistani (11.1%, a difference of 0.050%), Immigrants from Haiti (11.1%, a difference of 0.12%), Immigrants from St. Vincent and the Grenadines (11.1%, a difference of 0.13%), Austrian (11.1%, a difference of 0.17%), and Immigrants from Grenada (11.1%, a difference of 0.29%).
| Demographics | Rating | Rank | Disability Age 35 to 64 |
| Immigrants | North America | 74.9 /100 | #158 | Good 11.0% |
| Serbians | 73.6 /100 | #159 | Good 11.0% |
| Croatians | 73.1 /100 | #160 | Good 11.0% |
| Immigrants | Guyana | 70.1 /100 | #161 | Good 11.1% |
| Immigrants | Grenada | 68.4 /100 | #162 | Good 11.1% |
| Immigrants | St. Vincent and the Grenadines | 66.6 /100 | #163 | Good 11.1% |
| Pakistanis | 65.8 /100 | #164 | Good 11.1% |
| Immigrants | Western Europe | 65.2 /100 | #165 | Good 11.1% |
| Immigrants | Haiti | 63.8 /100 | #166 | Good 11.1% |
| Austrians | 63.2 /100 | #167 | Good 11.1% |
| Central Americans | 59.1 /100 | #168 | Average 11.2% |
| Haitians | 59.0 /100 | #169 | Average 11.2% |
| Immigrants | Uganda | 58.0 /100 | #170 | Average 11.2% |
| Immigrants | Trinidad and Tobago | 55.9 /100 | #171 | Average 11.2% |
| Italians | 55.6 /100 | #172 | Average 11.2% |
Demographics Similar to Northern Europeans by Disability Age 35 to 64
In terms of disability age 35 to 64, the demographic groups most similar to Northern Europeans are Immigrants from Bosnia and Herzegovina (11.4%, a difference of 0.020%), Hungarian (11.4%, a difference of 0.020%), Slovene (11.4%, a difference of 0.15%), Danish (11.4%, a difference of 0.16%), and Immigrants from Nigeria (11.4%, a difference of 0.21%).
| Demographics | Rating | Rank | Disability Age 35 to 64 |
| Trinidadians and Tobagonians | 40.8 /100 | #181 | Average 11.4% |
| Icelanders | 39.7 /100 | #182 | Fair 11.4% |
| Immigrants | Oceania | 39.5 /100 | #183 | Fair 11.4% |
| Kenyans | 39.2 /100 | #184 | Fair 11.4% |
| Danes | 36.8 /100 | #185 | Fair 11.4% |
| Slovenes | 36.6 /100 | #186 | Fair 11.4% |
| Immigrants | Bosnia and Herzegovina | 35.2 /100 | #187 | Fair 11.4% |
| Northern Europeans | 34.9 /100 | #188 | Fair 11.4% |
| Hungarians | 34.6 /100 | #189 | Fair 11.4% |
| Immigrants | Nigeria | 32.5 /100 | #190 | Fair 11.4% |
| Swedes | 31.3 /100 | #191 | Fair 11.4% |
| Norwegians | 29.7 /100 | #192 | Fair 11.5% |
| Immigrants | Africa | 29.0 /100 | #193 | Fair 11.5% |
| Immigrants | Latin America | 27.5 /100 | #194 | Fair 11.5% |
| Carpatho Rusyns | 25.3 /100 | #195 | Fair 11.5% |