Immigrants from Vietnam vs Malaysian Ambulatory Disability
COMPARE
Immigrants from Vietnam
Malaysian
Ambulatory Disability
Ambulatory Disability Comparison
Immigrants from Vietnam
Malaysians
5.7%
AMBULATORY DISABILITY
99.3/ 100
METRIC RATING
77th/ 347
METRIC RANK
6.2%
AMBULATORY DISABILITY
28.2/ 100
METRIC RATING
196th/ 347
METRIC RANK
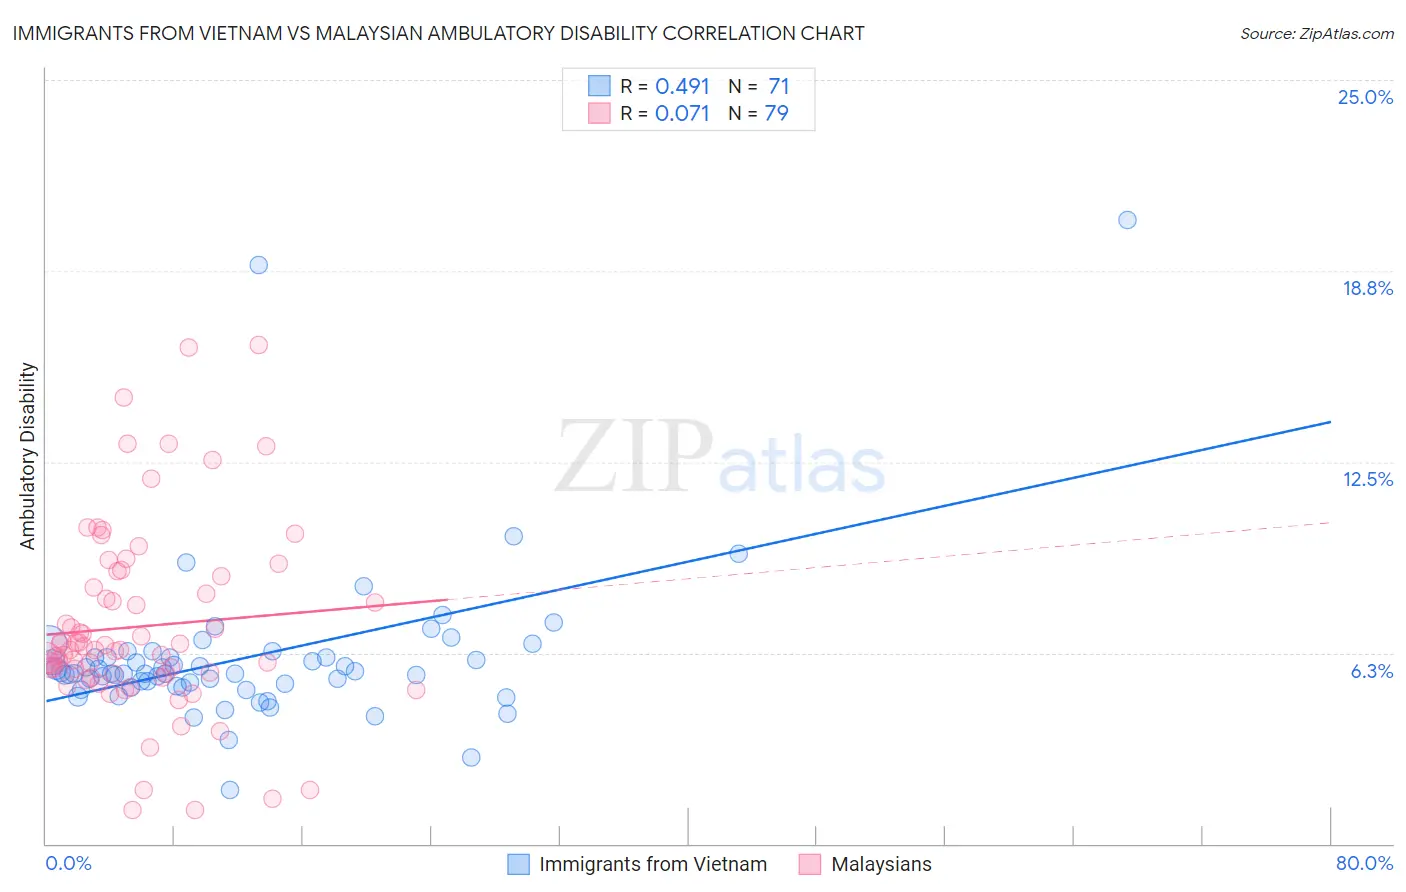
Immigrants from Vietnam vs Malaysian Ambulatory Disability Correlation Chart
The statistical analysis conducted on geographies consisting of 404,718,209 people shows a moderate positive correlation between the proportion of Immigrants from Vietnam and percentage of population with ambulatory disability in the United States with a correlation coefficient (R) of 0.491 and weighted average of 5.7%. Similarly, the statistical analysis conducted on geographies consisting of 226,050,790 people shows a slight positive correlation between the proportion of Malaysians and percentage of population with ambulatory disability in the United States with a correlation coefficient (R) of 0.071 and weighted average of 6.2%, a difference of 8.3%.
Ambulatory Disability Correlation Summary
| Measurement | Immigrants from Vietnam | Malaysian |
| Minimum | 1.8% | 1.1% |
| Maximum | 20.4% | 16.3% |
| Range | 18.7% | 15.2% |
| Mean | 6.1% | 7.1% |
| Median | 5.6% | 6.4% |
| Interquartile 25% (IQ1) | 5.2% | 5.6% |
| Interquartile 75% (IQ3) | 6.1% | 8.8% |
| Interquartile Range (IQR) | 0.95% | 3.2% |
| Standard Deviation (Sample) | 2.7% | 3.1% |
| Standard Deviation (Population) | 2.6% | 3.1% |
Similar Demographics by Ambulatory Disability
Demographics Similar to Immigrants from Vietnam by Ambulatory Disability
In terms of ambulatory disability, the demographic groups most similar to Immigrants from Vietnam are Somali (5.7%, a difference of 0.010%), Chilean (5.7%, a difference of 0.020%), Immigrants from Ireland (5.7%, a difference of 0.15%), Immigrants from Jordan (5.7%, a difference of 0.16%), and Palestinian (5.7%, a difference of 0.16%).
| Demographics | Rating | Rank | Ambulatory Disability |
| Sierra Leoneans | 99.4 /100 | #70 | Exceptional 5.7% |
| Immigrants | Peru | 99.4 /100 | #71 | Exceptional 5.7% |
| Brazilians | 99.4 /100 | #72 | Exceptional 5.7% |
| Immigrants | Northern Africa | 99.4 /100 | #73 | Exceptional 5.7% |
| Immigrants | Cameroon | 99.4 /100 | #74 | Exceptional 5.7% |
| Immigrants | South Africa | 99.3 /100 | #75 | Exceptional 5.7% |
| Sudanese | 99.3 /100 | #76 | Exceptional 5.7% |
| Immigrants | Vietnam | 99.3 /100 | #77 | Exceptional 5.7% |
| Somalis | 99.2 /100 | #78 | Exceptional 5.7% |
| Chileans | 99.2 /100 | #79 | Exceptional 5.7% |
| Immigrants | Ireland | 99.2 /100 | #80 | Exceptional 5.7% |
| Immigrants | Jordan | 99.2 /100 | #81 | Exceptional 5.7% |
| Palestinians | 99.2 /100 | #82 | Exceptional 5.7% |
| Eastern Europeans | 99.2 /100 | #83 | Exceptional 5.7% |
| Ugandans | 99.2 /100 | #84 | Exceptional 5.7% |
Demographics Similar to Malaysians by Ambulatory Disability
In terms of ambulatory disability, the demographic groups most similar to Malaysians are Belgian (6.2%, a difference of 0.030%), Alaska Native (6.2%, a difference of 0.10%), Guatemalan (6.2%, a difference of 0.11%), Polish (6.2%, a difference of 0.12%), and Immigrants from Western Europe (6.2%, a difference of 0.21%).
| Demographics | Rating | Rank | Ambulatory Disability |
| Ukrainians | 34.0 /100 | #189 | Fair 6.2% |
| Immigrants | Western Africa | 33.4 /100 | #190 | Fair 6.2% |
| Immigrants | Guatemala | 31.9 /100 | #191 | Fair 6.2% |
| Immigrants | Western Europe | 31.6 /100 | #192 | Fair 6.2% |
| Guatemalans | 30.0 /100 | #193 | Fair 6.2% |
| Alaska Natives | 29.8 /100 | #194 | Fair 6.2% |
| Belgians | 28.6 /100 | #195 | Fair 6.2% |
| Malaysians | 28.2 /100 | #196 | Fair 6.2% |
| Poles | 26.3 /100 | #197 | Fair 6.2% |
| Immigrants | Bangladesh | 24.6 /100 | #198 | Fair 6.2% |
| Italians | 22.6 /100 | #199 | Fair 6.2% |
| Immigrants | Cambodia | 21.5 /100 | #200 | Fair 6.2% |
| Immigrants | Central America | 20.1 /100 | #201 | Fair 6.2% |
| Albanians | 19.7 /100 | #202 | Poor 6.2% |
| Immigrants | Ukraine | 18.4 /100 | #203 | Poor 6.2% |