Immigrants from Uzbekistan vs Palestinian Disability Age 65 to 74
COMPARE
Immigrants from Uzbekistan
Palestinian
Disability Age 65 to 74
Disability Age 65 to 74 Comparison
Immigrants from Uzbekistan
Palestinians
22.8%
DISABILITY AGE 65 TO 74
83.1/ 100
METRIC RATING
147th/ 347
METRIC RANK
22.2%
DISABILITY AGE 65 TO 74
96.3/ 100
METRIC RATING
105th/ 347
METRIC RANK
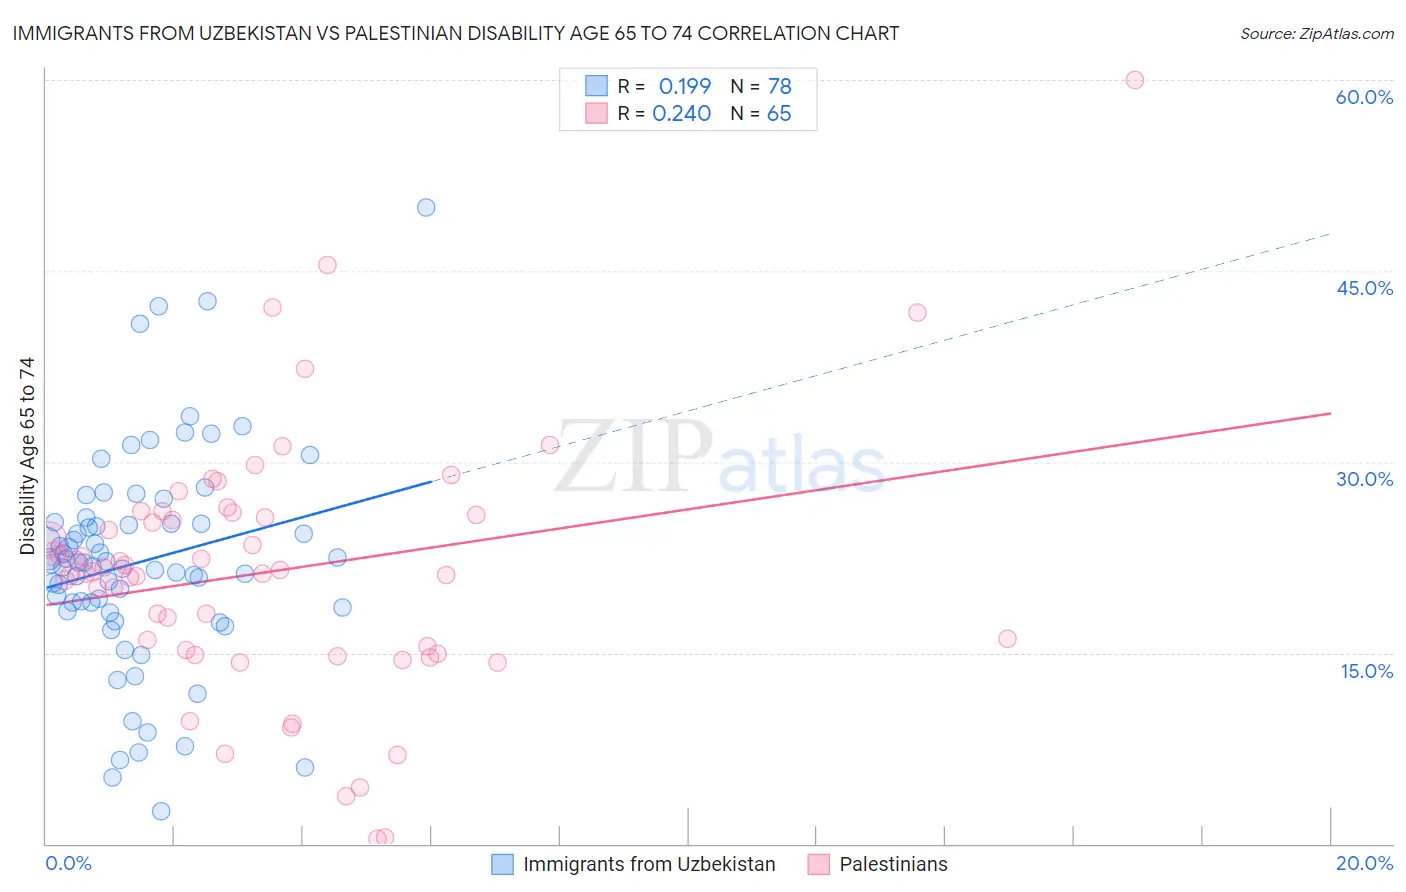
Immigrants from Uzbekistan vs Palestinian Disability Age 65 to 74 Correlation Chart
The statistical analysis conducted on geographies consisting of 118,581,209 people shows a poor positive correlation between the proportion of Immigrants from Uzbekistan and percentage of population with a disability between the ages 65 and 75 in the United States with a correlation coefficient (R) of 0.199 and weighted average of 22.8%. Similarly, the statistical analysis conducted on geographies consisting of 216,253,124 people shows a weak positive correlation between the proportion of Palestinians and percentage of population with a disability between the ages 65 and 75 in the United States with a correlation coefficient (R) of 0.240 and weighted average of 22.2%, a difference of 2.5%.
Disability Age 65 to 74 Correlation Summary
| Measurement | Immigrants from Uzbekistan | Palestinian |
| Minimum | 2.6% | 0.44% |
| Maximum | 50.0% | 60.0% |
| Range | 47.4% | 59.6% |
| Mean | 22.1% | 21.4% |
| Median | 22.0% | 21.4% |
| Interquartile 25% (IQ1) | 18.6% | 15.0% |
| Interquartile 75% (IQ3) | 25.2% | 25.9% |
| Interquartile Range (IQR) | 6.6% | 10.9% |
| Standard Deviation (Sample) | 8.4% | 10.2% |
| Standard Deviation (Population) | 8.4% | 10.1% |
Similar Demographics by Disability Age 65 to 74
Demographics Similar to Immigrants from Uzbekistan by Disability Age 65 to 74
In terms of disability age 65 to 74, the demographic groups most similar to Immigrants from Uzbekistan are Alsatian (22.8%, a difference of 0.070%), Immigrants from Uganda (22.8%, a difference of 0.10%), Danish (22.8%, a difference of 0.14%), Arab (22.8%, a difference of 0.19%), and Immigrants from Ethiopia (22.7%, a difference of 0.25%).
| Demographics | Rating | Rank | Disability Age 65 to 74 |
| Ugandans | 85.4 /100 | #140 | Excellent 22.7% |
| Belgians | 85.3 /100 | #141 | Excellent 22.7% |
| Immigrants | Ethiopia | 85.3 /100 | #142 | Excellent 22.7% |
| Arabs | 84.8 /100 | #143 | Excellent 22.8% |
| Danes | 84.4 /100 | #144 | Excellent 22.8% |
| Immigrants | Uganda | 84.0 /100 | #145 | Excellent 22.8% |
| Alsatians | 83.7 /100 | #146 | Excellent 22.8% |
| Immigrants | Uzbekistan | 83.1 /100 | #147 | Excellent 22.8% |
| New Zealanders | 79.9 /100 | #148 | Good 22.9% |
| Swiss | 79.7 /100 | #149 | Good 22.9% |
| Canadians | 77.7 /100 | #150 | Good 22.9% |
| Immigrants | Morocco | 77.6 /100 | #151 | Good 22.9% |
| Finns | 76.5 /100 | #152 | Good 22.9% |
| Slavs | 75.2 /100 | #153 | Good 23.0% |
| Sri Lankans | 74.0 /100 | #154 | Good 23.0% |
Demographics Similar to Palestinians by Disability Age 65 to 74
In terms of disability age 65 to 74, the demographic groups most similar to Palestinians are Colombian (22.2%, a difference of 0.040%), South American (22.2%, a difference of 0.050%), Peruvian (22.2%, a difference of 0.060%), Slovene (22.2%, a difference of 0.070%), and Immigrants from Saudi Arabia (22.2%, a difference of 0.080%).
| Demographics | Rating | Rank | Disability Age 65 to 74 |
| Jordanians | 96.9 /100 | #98 | Exceptional 22.2% |
| Immigrants | Colombia | 96.8 /100 | #99 | Exceptional 22.2% |
| Uruguayans | 96.5 /100 | #100 | Exceptional 22.2% |
| Immigrants | England | 96.5 /100 | #101 | Exceptional 22.2% |
| Immigrants | Saudi Arabia | 96.4 /100 | #102 | Exceptional 22.2% |
| South Americans | 96.4 /100 | #103 | Exceptional 22.2% |
| Colombians | 96.4 /100 | #104 | Exceptional 22.2% |
| Palestinians | 96.3 /100 | #105 | Exceptional 22.2% |
| Peruvians | 96.1 /100 | #106 | Exceptional 22.2% |
| Slovenes | 96.1 /100 | #107 | Exceptional 22.2% |
| Immigrants | Zimbabwe | 96.1 /100 | #108 | Exceptional 22.3% |
| Albanians | 95.8 /100 | #109 | Exceptional 22.3% |
| Immigrants | Peru | 95.7 /100 | #110 | Exceptional 22.3% |
| Serbians | 95.7 /100 | #111 | Exceptional 22.3% |
| Immigrants | South America | 95.5 /100 | #112 | Exceptional 22.3% |