Immigrants from Uruguay vs Immigrants from Costa Rica Disability Age 18 to 34
COMPARE
Immigrants from Uruguay
Immigrants from Costa Rica
Disability Age 18 to 34
Disability Age 18 to 34 Comparison
Immigrants from Uruguay
Immigrants from Costa Rica
6.2%
DISABILITY AGE 18 TO 34
97.4/ 100
METRIC RATING
96th/ 347
METRIC RANK
6.3%
DISABILITY AGE 18 TO 34
94.0/ 100
METRIC RATING
116th/ 347
METRIC RANK
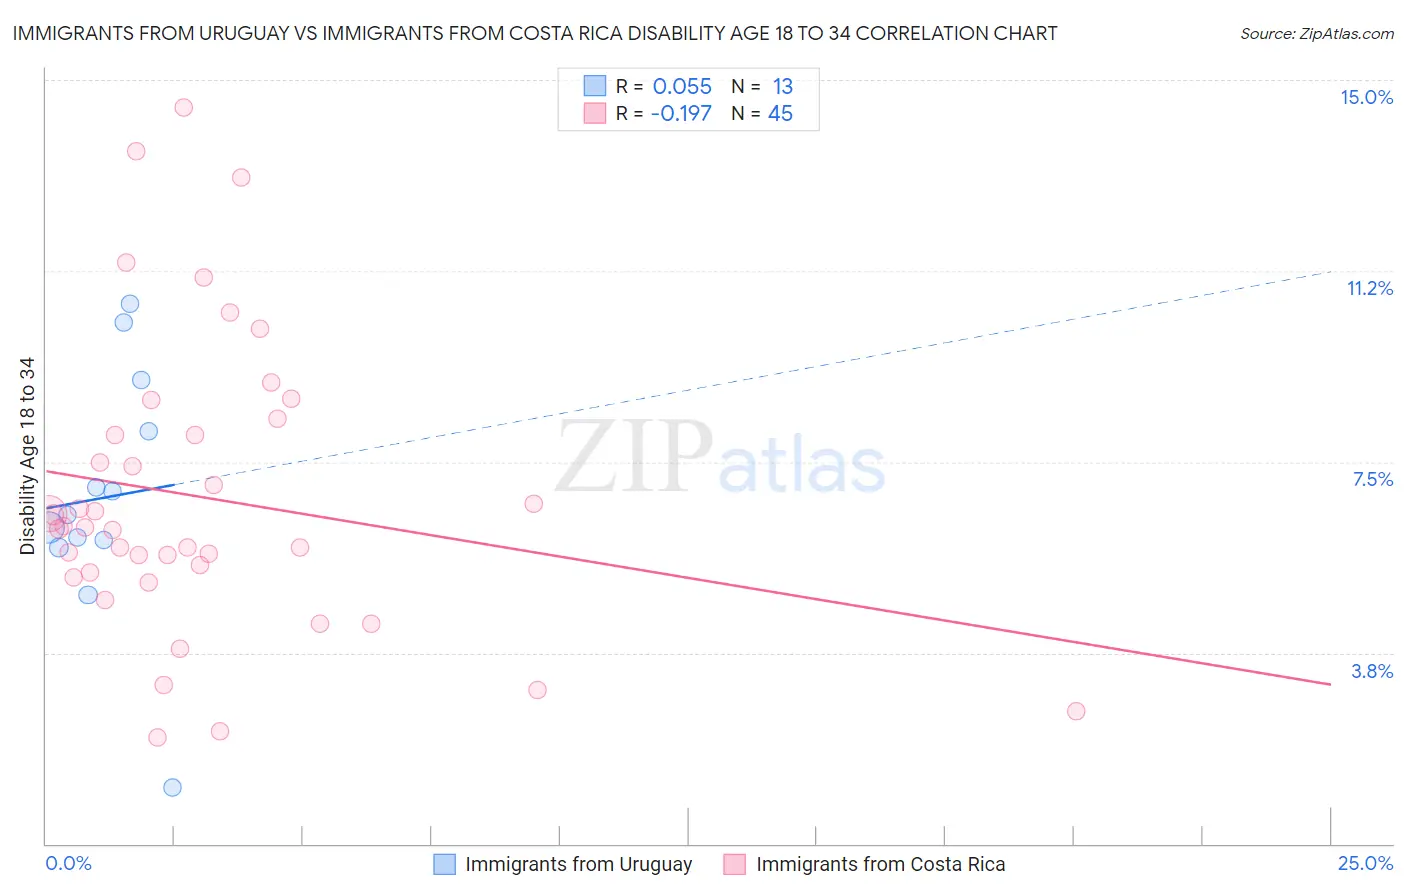
Immigrants from Uruguay vs Immigrants from Costa Rica Disability Age 18 to 34 Correlation Chart
The statistical analysis conducted on geographies consisting of 133,205,163 people shows a slight positive correlation between the proportion of Immigrants from Uruguay and percentage of population with a disability between the ages 18 and 35 in the United States with a correlation coefficient (R) of 0.055 and weighted average of 6.2%. Similarly, the statistical analysis conducted on geographies consisting of 204,150,965 people shows a poor negative correlation between the proportion of Immigrants from Costa Rica and percentage of population with a disability between the ages 18 and 35 in the United States with a correlation coefficient (R) of -0.197 and weighted average of 6.3%, a difference of 1.6%.
Disability Age 18 to 34 Correlation Summary
| Measurement | Immigrants from Uruguay | Immigrants from Costa Rica |
| Minimum | 1.1% | 2.1% |
| Maximum | 10.6% | 14.5% |
| Range | 9.5% | 12.4% |
| Mean | 6.8% | 6.8% |
| Median | 6.5% | 6.2% |
| Interquartile 25% (IQ1) | 5.9% | 5.3% |
| Interquartile 75% (IQ3) | 8.6% | 8.2% |
| Interquartile Range (IQR) | 2.7% | 2.9% |
| Standard Deviation (Sample) | 2.5% | 2.9% |
| Standard Deviation (Population) | 2.4% | 2.8% |
Demographics Similar to Immigrants from Uruguay and Immigrants from Costa Rica by Disability Age 18 to 34
In terms of disability age 18 to 34, the demographic groups most similar to Immigrants from Uruguay are Uruguayan (6.2%, a difference of 0.080%), Immigrants from Syria (6.2%, a difference of 0.13%), Immigrants from Ethiopia (6.2%, a difference of 0.34%), Immigrants from Albania (6.2%, a difference of 0.45%), and Immigrants from Jamaica (6.2%, a difference of 0.61%). Similarly, the demographic groups most similar to Immigrants from Costa Rica are Korean (6.3%, a difference of 0.030%), Immigrants from South Eastern Asia (6.3%, a difference of 0.15%), Immigrants from Romania (6.3%, a difference of 0.33%), Immigrants from Latin America (6.3%, a difference of 0.33%), and Immigrants from France (6.3%, a difference of 0.42%).
| Demographics | Rating | Rank | Disability Age 18 to 34 |
| Immigrants | Uruguay | 97.4 /100 | #96 | Exceptional 6.2% |
| Uruguayans | 97.3 /100 | #97 | Exceptional 6.2% |
| Immigrants | Syria | 97.2 /100 | #98 | Exceptional 6.2% |
| Immigrants | Ethiopia | 96.9 /100 | #99 | Exceptional 6.2% |
| Immigrants | Albania | 96.7 /100 | #100 | Exceptional 6.2% |
| Immigrants | Jamaica | 96.4 /100 | #101 | Exceptional 6.2% |
| Laotians | 96.4 /100 | #102 | Exceptional 6.2% |
| Immigrants | Bulgaria | 96.3 /100 | #103 | Exceptional 6.2% |
| Mongolians | 96.2 /100 | #104 | Exceptional 6.2% |
| Bhutanese | 96.2 /100 | #105 | Exceptional 6.2% |
| Immigrants | Afghanistan | 95.9 /100 | #106 | Exceptional 6.2% |
| Ethiopians | 95.8 /100 | #107 | Exceptional 6.2% |
| Immigrants | Croatia | 95.7 /100 | #108 | Exceptional 6.2% |
| Sri Lankans | 95.5 /100 | #109 | Exceptional 6.2% |
| Immigrants | Brazil | 95.2 /100 | #110 | Exceptional 6.3% |
| Immigrants | France | 95.1 /100 | #111 | Exceptional 6.3% |
| Immigrants | Romania | 94.9 /100 | #112 | Exceptional 6.3% |
| Immigrants | Latin America | 94.9 /100 | #113 | Exceptional 6.3% |
| Immigrants | South Eastern Asia | 94.4 /100 | #114 | Exceptional 6.3% |
| Koreans | 94.1 /100 | #115 | Exceptional 6.3% |
| Immigrants | Costa Rica | 94.0 /100 | #116 | Exceptional 6.3% |