Immigrants from Uruguay vs Immigrants from Barbados Ambulatory Disability
COMPARE
Immigrants from Uruguay
Immigrants from Barbados
Ambulatory Disability
Ambulatory Disability Comparison
Immigrants from Uruguay
Immigrants from Barbados
5.9%
AMBULATORY DISABILITY
95.6/ 100
METRIC RATING
113th/ 347
METRIC RANK
6.8%
AMBULATORY DISABILITY
0.0/ 100
METRIC RATING
283rd/ 347
METRIC RANK
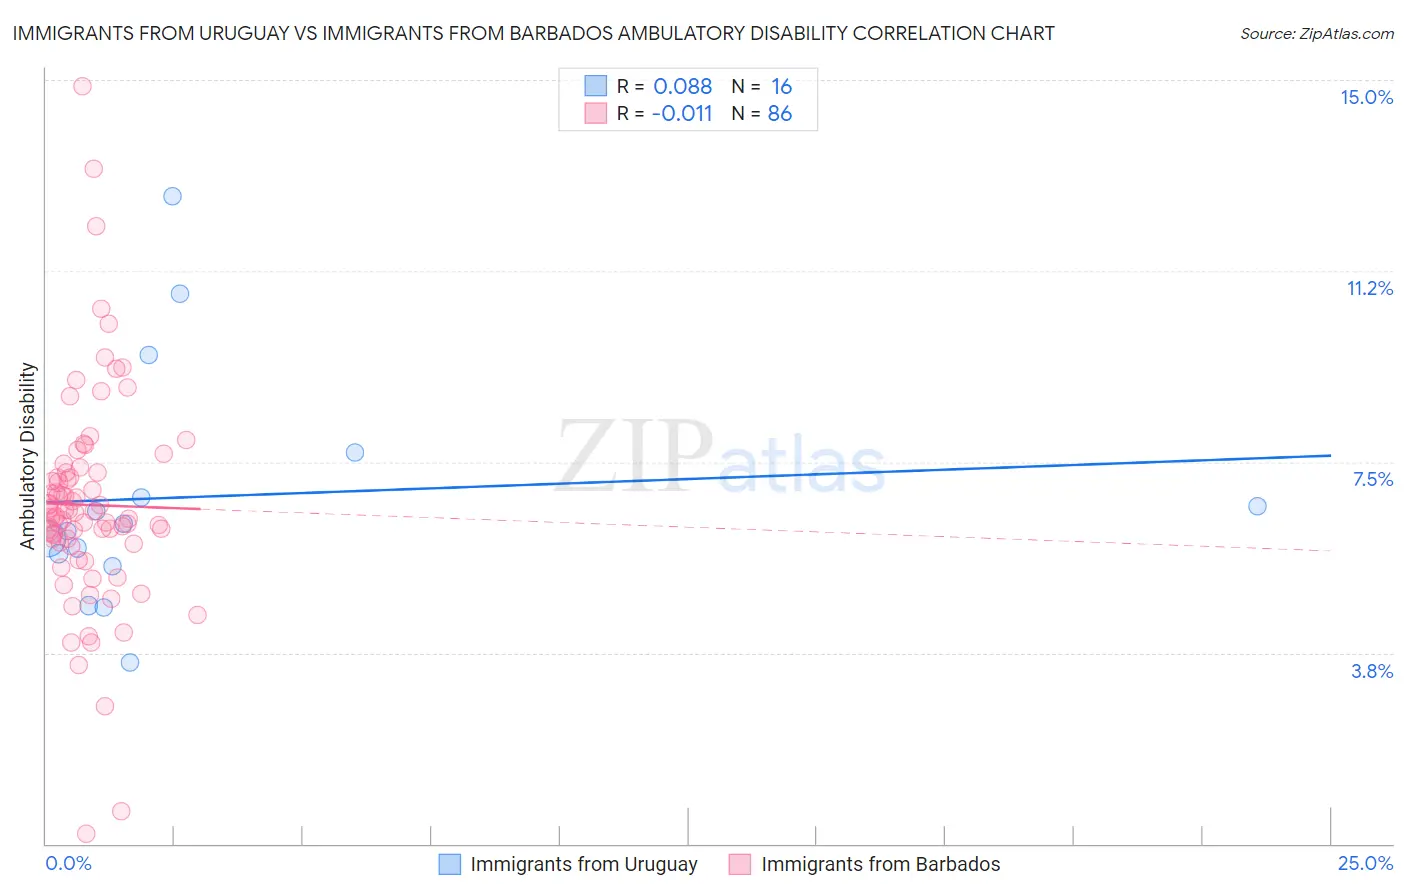
Immigrants from Uruguay vs Immigrants from Barbados Ambulatory Disability Correlation Chart
The statistical analysis conducted on geographies consisting of 133,255,356 people shows a slight positive correlation between the proportion of Immigrants from Uruguay and percentage of population with ambulatory disability in the United States with a correlation coefficient (R) of 0.088 and weighted average of 5.9%. Similarly, the statistical analysis conducted on geographies consisting of 112,777,280 people shows no correlation between the proportion of Immigrants from Barbados and percentage of population with ambulatory disability in the United States with a correlation coefficient (R) of -0.011 and weighted average of 6.8%, a difference of 15.5%.
Ambulatory Disability Correlation Summary
| Measurement | Immigrants from Uruguay | Immigrants from Barbados |
| Minimum | 3.6% | 0.21% |
| Maximum | 12.7% | 14.9% |
| Range | 9.2% | 14.7% |
| Mean | 6.8% | 6.7% |
| Median | 6.2% | 6.5% |
| Interquartile 25% (IQ1) | 5.6% | 5.9% |
| Interquartile 75% (IQ3) | 7.2% | 7.3% |
| Interquartile Range (IQR) | 1.7% | 1.4% |
| Standard Deviation (Sample) | 2.4% | 2.1% |
| Standard Deviation (Population) | 2.3% | 2.1% |
Similar Demographics by Ambulatory Disability
Demographics Similar to Immigrants from Uruguay by Ambulatory Disability
In terms of ambulatory disability, the demographic groups most similar to Immigrants from Uruguay are Immigrants from Poland (5.9%, a difference of 0.060%), South African (5.9%, a difference of 0.22%), South American Indian (5.9%, a difference of 0.26%), Immigrants from Africa (5.9%, a difference of 0.28%), and Danish (5.8%, a difference of 0.35%).
| Demographics | Rating | Rank | Ambulatory Disability |
| Immigrants | Morocco | 97.3 /100 | #106 | Exceptional 5.8% |
| Uruguayans | 97.2 /100 | #107 | Exceptional 5.8% |
| Colombians | 97.2 /100 | #108 | Exceptional 5.8% |
| Immigrants | Netherlands | 97.1 /100 | #109 | Exceptional 5.8% |
| Immigrants | Colombia | 96.7 /100 | #110 | Exceptional 5.8% |
| Danes | 96.6 /100 | #111 | Exceptional 5.8% |
| South Africans | 96.3 /100 | #112 | Exceptional 5.9% |
| Immigrants | Uruguay | 95.6 /100 | #113 | Exceptional 5.9% |
| Immigrants | Poland | 95.4 /100 | #114 | Exceptional 5.9% |
| South American Indians | 94.8 /100 | #115 | Exceptional 5.9% |
| Immigrants | Africa | 94.7 /100 | #116 | Exceptional 5.9% |
| Immigrants | South Eastern Asia | 93.6 /100 | #117 | Exceptional 5.9% |
| Russians | 93.4 /100 | #118 | Exceptional 5.9% |
| Norwegians | 93.1 /100 | #119 | Exceptional 5.9% |
| Estonians | 92.9 /100 | #120 | Exceptional 5.9% |
Demographics Similar to Immigrants from Barbados by Ambulatory Disability
In terms of ambulatory disability, the demographic groups most similar to Immigrants from Barbados are Immigrants from Jamaica (6.8%, a difference of 0.070%), Barbadian (6.8%, a difference of 0.16%), Yaqui (6.8%, a difference of 0.28%), Pennsylvania German (6.8%, a difference of 0.36%), and Immigrants from Caribbean (6.7%, a difference of 0.45%).
| Demographics | Rating | Rank | Ambulatory Disability |
| Celtics | 0.1 /100 | #276 | Tragic 6.7% |
| Jamaicans | 0.1 /100 | #277 | Tragic 6.7% |
| Immigrants | West Indies | 0.1 /100 | #278 | Tragic 6.7% |
| Immigrants | Caribbean | 0.0 /100 | #279 | Tragic 6.7% |
| Pennsylvania Germans | 0.0 /100 | #280 | Tragic 6.8% |
| Yaqui | 0.0 /100 | #281 | Tragic 6.8% |
| Barbadians | 0.0 /100 | #282 | Tragic 6.8% |
| Immigrants | Barbados | 0.0 /100 | #283 | Tragic 6.8% |
| Immigrants | Jamaica | 0.0 /100 | #284 | Tragic 6.8% |
| Fijians | 0.0 /100 | #285 | Tragic 6.8% |
| Yakama | 0.0 /100 | #286 | Tragic 6.8% |
| U.S. Virgin Islanders | 0.0 /100 | #287 | Tragic 6.8% |
| Immigrants | Nonimmigrants | 0.0 /100 | #288 | Tragic 6.9% |
| Immigrants | Dominica | 0.0 /100 | #289 | Tragic 6.9% |
| Scotch-Irish | 0.0 /100 | #290 | Tragic 6.9% |