Immigrants from Ukraine vs Mexican American Indian Hearing Disability
COMPARE
Immigrants from Ukraine
Mexican American Indian
Hearing Disability
Hearing Disability Comparison
Immigrants from Ukraine
Mexican American Indians
3.0%
HEARING DISABILITY
56.6/ 100
METRIC RATING
171st/ 347
METRIC RANK
3.0%
HEARING DISABILITY
34.7/ 100
METRIC RATING
188th/ 347
METRIC RANK
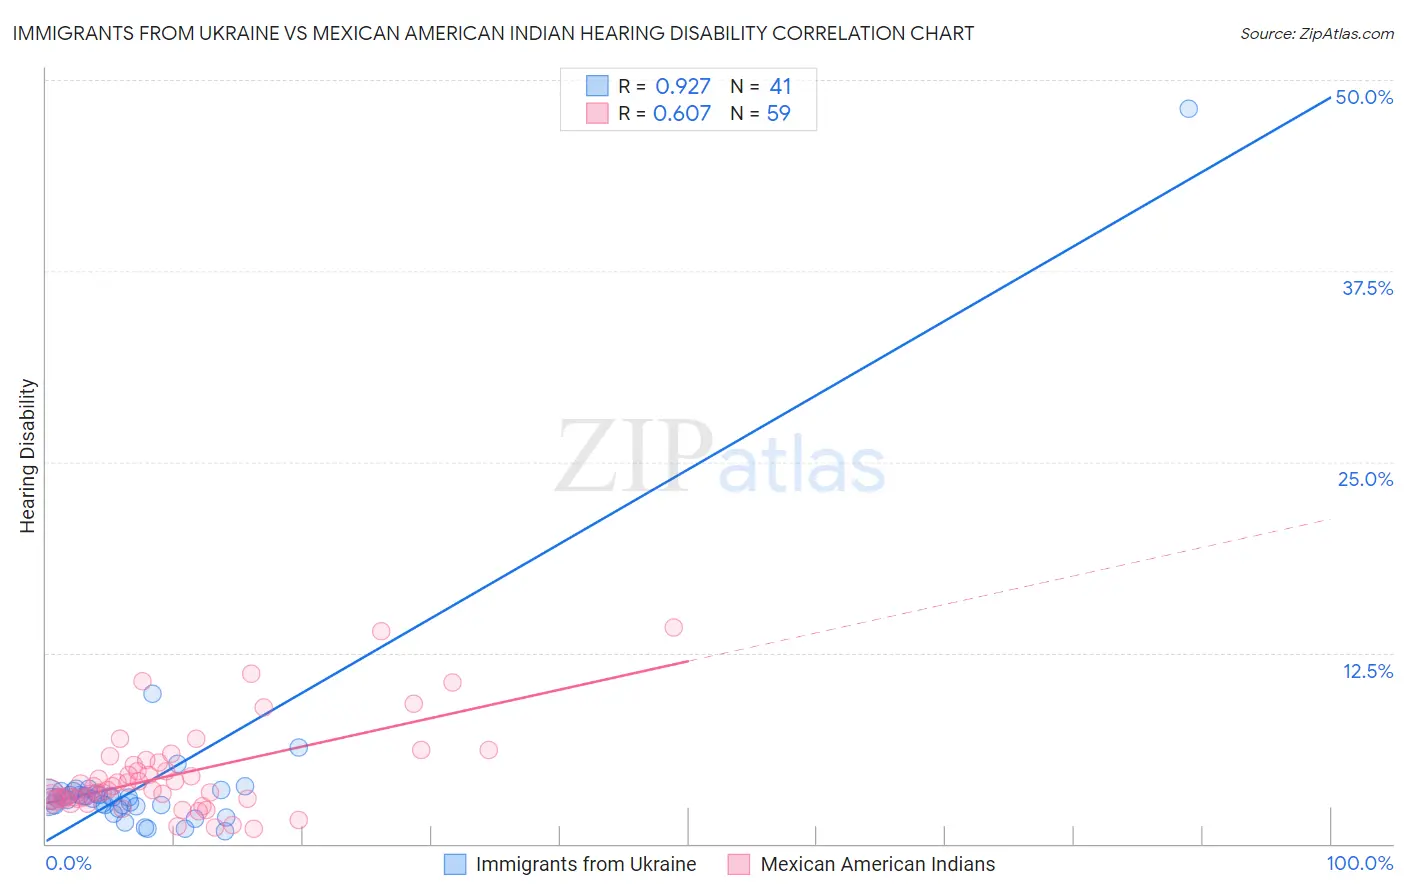
Immigrants from Ukraine vs Mexican American Indian Hearing Disability Correlation Chart
The statistical analysis conducted on geographies consisting of 289,631,097 people shows a near-perfect positive correlation between the proportion of Immigrants from Ukraine and percentage of population with hearing disability in the United States with a correlation coefficient (R) of 0.927 and weighted average of 3.0%. Similarly, the statistical analysis conducted on geographies consisting of 317,548,375 people shows a significant positive correlation between the proportion of Mexican American Indians and percentage of population with hearing disability in the United States with a correlation coefficient (R) of 0.607 and weighted average of 3.0%, a difference of 2.1%.
Hearing Disability Correlation Summary
| Measurement | Immigrants from Ukraine | Mexican American Indian |
| Minimum | 0.79% | 1.0% |
| Maximum | 48.1% | 14.2% |
| Range | 47.4% | 13.2% |
| Mean | 4.1% | 4.5% |
| Median | 3.0% | 3.6% |
| Interquartile 25% (IQ1) | 2.5% | 2.9% |
| Interquartile 75% (IQ3) | 3.3% | 5.3% |
| Interquartile Range (IQR) | 0.84% | 2.3% |
| Standard Deviation (Sample) | 7.2% | 2.9% |
| Standard Deviation (Population) | 7.1% | 2.9% |
Demographics Similar to Immigrants from Ukraine and Mexican American Indians by Hearing Disability
In terms of hearing disability, the demographic groups most similar to Immigrants from Ukraine are Immigrants from Cabo Verde (3.0%, a difference of 0.030%), Armenian (3.0%, a difference of 0.060%), Arab (3.0%, a difference of 0.10%), Immigrants from Serbia (3.0%, a difference of 0.53%), and Indonesian (3.0%, a difference of 0.63%). Similarly, the demographic groups most similar to Mexican American Indians are Black/African American (3.0%, a difference of 0.010%), Immigrants from Mexico (3.0%, a difference of 0.020%), Immigrants from Southern Europe (3.0%, a difference of 0.070%), African (3.0%, a difference of 0.19%), and Immigrants from Ireland (3.0%, a difference of 0.27%).
| Demographics | Rating | Rank | Hearing Disability |
| Arabs | 57.6 /100 | #169 | Average 3.0% |
| Immigrants | Cabo Verde | 56.9 /100 | #170 | Average 3.0% |
| Immigrants | Ukraine | 56.6 /100 | #171 | Average 3.0% |
| Armenians | 56.0 /100 | #172 | Average 3.0% |
| Immigrants | Serbia | 51.1 /100 | #173 | Average 3.0% |
| Indonesians | 50.0 /100 | #174 | Average 3.0% |
| Immigrants | Romania | 48.4 /100 | #175 | Average 3.0% |
| Panamanians | 47.0 /100 | #176 | Average 3.0% |
| Immigrants | Philippines | 46.4 /100 | #177 | Average 3.0% |
| Japanese | 46.0 /100 | #178 | Average 3.0% |
| Immigrants | Moldova | 43.1 /100 | #179 | Average 3.0% |
| Immigrants | Sweden | 42.4 /100 | #180 | Average 3.0% |
| Immigrants | Belgium | 41.5 /100 | #181 | Average 3.0% |
| Immigrants | Italy | 41.1 /100 | #182 | Average 3.0% |
| Bulgarians | 39.7 /100 | #183 | Fair 3.0% |
| Immigrants | Ireland | 37.4 /100 | #184 | Fair 3.0% |
| Immigrants | Southern Europe | 35.3 /100 | #185 | Fair 3.0% |
| Immigrants | Mexico | 34.9 /100 | #186 | Fair 3.0% |
| Blacks/African Americans | 34.7 /100 | #187 | Fair 3.0% |
| Mexican American Indians | 34.7 /100 | #188 | Fair 3.0% |
| Africans | 32.9 /100 | #189 | Fair 3.0% |