Immigrants from Ukraine vs Belizean Disability Age 65 to 74
COMPARE
Immigrants from Ukraine
Belizean
Disability Age 65 to 74
Disability Age 65 to 74 Comparison
Immigrants from Ukraine
Belizeans
22.6%
DISABILITY AGE 65 TO 74
88.4/ 100
METRIC RATING
135th/ 347
METRIC RANK
25.8%
DISABILITY AGE 65 TO 74
0.1/ 100
METRIC RATING
277th/ 347
METRIC RANK
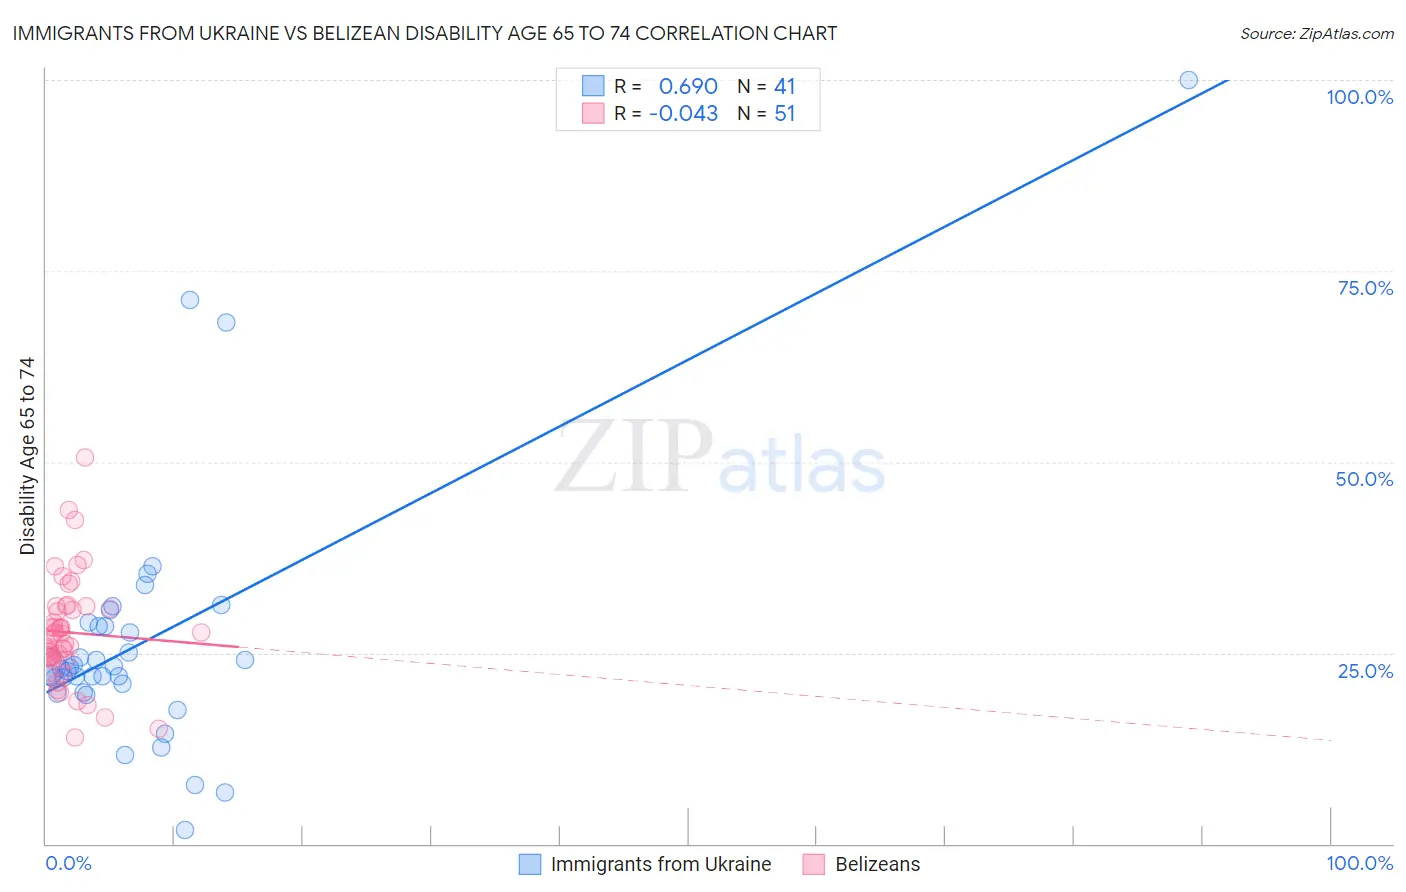
Immigrants from Ukraine vs Belizean Disability Age 65 to 74 Correlation Chart
The statistical analysis conducted on geographies consisting of 289,367,619 people shows a significant positive correlation between the proportion of Immigrants from Ukraine and percentage of population with a disability between the ages 65 and 75 in the United States with a correlation coefficient (R) of 0.690 and weighted average of 22.6%. Similarly, the statistical analysis conducted on geographies consisting of 144,105,664 people shows no correlation between the proportion of Belizeans and percentage of population with a disability between the ages 65 and 75 in the United States with a correlation coefficient (R) of -0.043 and weighted average of 25.8%, a difference of 14.1%.
Disability Age 65 to 74 Correlation Summary
| Measurement | Immigrants from Ukraine | Belizean |
| Minimum | 1.9% | 14.0% |
| Maximum | 100.0% | 50.6% |
| Range | 98.1% | 36.6% |
| Mean | 26.7% | 27.7% |
| Median | 23.2% | 27.4% |
| Interquartile 25% (IQ1) | 20.3% | 24.4% |
| Interquartile 75% (IQ3) | 28.8% | 31.0% |
| Interquartile Range (IQR) | 8.4% | 6.6% |
| Standard Deviation (Sample) | 17.2% | 7.0% |
| Standard Deviation (Population) | 17.0% | 6.9% |
Similar Demographics by Disability Age 65 to 74
Demographics Similar to Immigrants from Ukraine by Disability Age 65 to 74
In terms of disability age 65 to 74, the demographic groups most similar to Immigrants from Ukraine are Afghan (22.6%, a difference of 0.030%), Ethiopian (22.7%, a difference of 0.070%), Northern European (22.6%, a difference of 0.080%), Taiwanese (22.7%, a difference of 0.10%), and Costa Rican (22.6%, a difference of 0.13%).
| Demographics | Rating | Rank | Disability Age 65 to 74 |
| Immigrants | Costa Rica | 90.4 /100 | #128 | Exceptional 22.6% |
| Immigrants | Uruguay | 90.1 /100 | #129 | Exceptional 22.6% |
| Immigrants | Albania | 90.0 /100 | #130 | Excellent 22.6% |
| Immigrants | Nepal | 89.4 /100 | #131 | Excellent 22.6% |
| Costa Ricans | 89.2 /100 | #132 | Excellent 22.6% |
| Northern Europeans | 88.9 /100 | #133 | Excellent 22.6% |
| Afghans | 88.6 /100 | #134 | Excellent 22.6% |
| Immigrants | Ukraine | 88.4 /100 | #135 | Excellent 22.6% |
| Ethiopians | 87.9 /100 | #136 | Excellent 22.7% |
| Taiwanese | 87.6 /100 | #137 | Excellent 22.7% |
| Immigrants | Moldova | 87.3 /100 | #138 | Excellent 22.7% |
| Immigrants | Syria | 85.8 /100 | #139 | Excellent 22.7% |
| Ugandans | 85.4 /100 | #140 | Excellent 22.7% |
| Belgians | 85.3 /100 | #141 | Excellent 22.7% |
| Immigrants | Ethiopia | 85.3 /100 | #142 | Excellent 22.7% |
Demographics Similar to Belizeans by Disability Age 65 to 74
In terms of disability age 65 to 74, the demographic groups most similar to Belizeans are Immigrants from Belize (25.8%, a difference of 0.020%), French American Indian (25.8%, a difference of 0.090%), Honduran (25.8%, a difference of 0.10%), U.S. Virgin Islander (25.9%, a difference of 0.10%), and American (25.8%, a difference of 0.11%).
| Demographics | Rating | Rank | Disability Age 65 to 74 |
| Immigrants | Guatemala | 0.1 /100 | #270 | Tragic 25.7% |
| Immigrants | Liberia | 0.1 /100 | #271 | Tragic 25.7% |
| Immigrants | Dominica | 0.1 /100 | #272 | Tragic 25.7% |
| Japanese | 0.1 /100 | #273 | Tragic 25.7% |
| Americans | 0.1 /100 | #274 | Tragic 25.8% |
| Hondurans | 0.1 /100 | #275 | Tragic 25.8% |
| French American Indians | 0.1 /100 | #276 | Tragic 25.8% |
| Belizeans | 0.1 /100 | #277 | Tragic 25.8% |
| Immigrants | Belize | 0.1 /100 | #278 | Tragic 25.8% |
| U.S. Virgin Islanders | 0.1 /100 | #279 | Tragic 25.9% |
| Cree | 0.1 /100 | #280 | Tragic 25.9% |
| Immigrants | Honduras | 0.1 /100 | #281 | Tragic 25.9% |
| Delaware | 0.1 /100 | #282 | Tragic 25.9% |
| Spanish Americans | 0.0 /100 | #283 | Tragic 25.9% |
| Immigrants | Azores | 0.0 /100 | #284 | Tragic 26.0% |