Immigrants from Trinidad and Tobago vs Immigrants from Iran Disability Age 35 to 64
COMPARE
Immigrants from Trinidad and Tobago
Immigrants from Iran
Disability Age 35 to 64
Disability Age 35 to 64 Comparison
Immigrants from Trinidad and Tobago
Immigrants from Iran
11.2%
DISABILITY AGE 35 TO 64
55.9/ 100
METRIC RATING
171st/ 347
METRIC RANK
8.5%
DISABILITY AGE 35 TO 64
100.0/ 100
METRIC RATING
5th/ 347
METRIC RANK
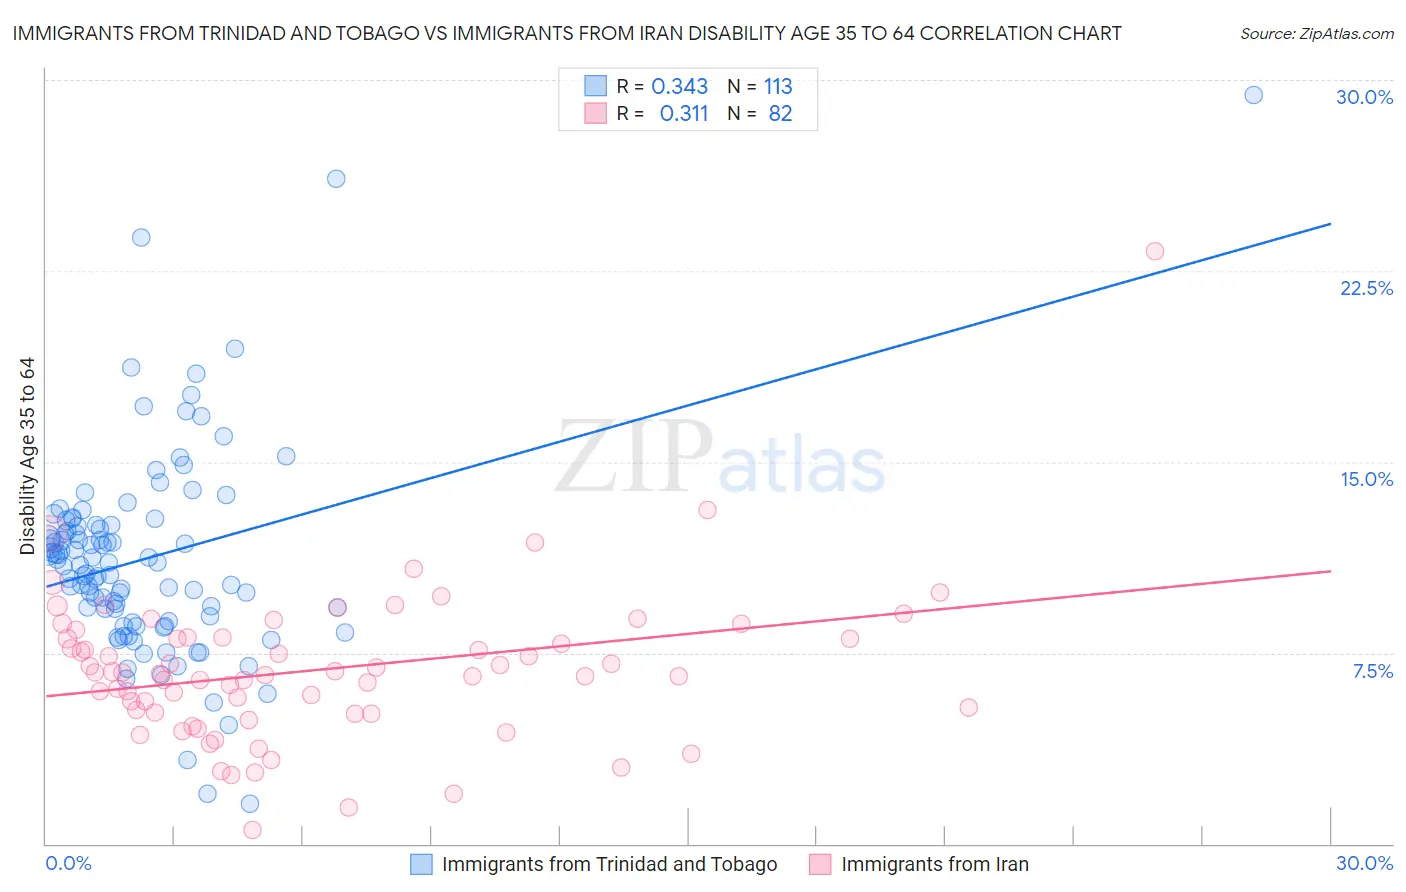
Immigrants from Trinidad and Tobago vs Immigrants from Iran Disability Age 35 to 64 Correlation Chart
The statistical analysis conducted on geographies consisting of 223,452,202 people shows a mild positive correlation between the proportion of Immigrants from Trinidad and Tobago and percentage of population with a disability between the ages 34 and 64 in the United States with a correlation coefficient (R) of 0.343 and weighted average of 11.2%. Similarly, the statistical analysis conducted on geographies consisting of 279,816,013 people shows a mild positive correlation between the proportion of Immigrants from Iran and percentage of population with a disability between the ages 34 and 64 in the United States with a correlation coefficient (R) of 0.311 and weighted average of 8.5%, a difference of 32.1%.
Disability Age 35 to 64 Correlation Summary
| Measurement | Immigrants from Trinidad and Tobago | Immigrants from Iran |
| Minimum | 1.6% | 0.52% |
| Maximum | 29.4% | 23.3% |
| Range | 27.9% | 22.7% |
| Mean | 11.2% | 6.8% |
| Median | 11.0% | 6.7% |
| Interquartile 25% (IQ1) | 8.8% | 5.1% |
| Interquartile 75% (IQ3) | 12.5% | 8.1% |
| Interquartile Range (IQR) | 3.7% | 3.0% |
| Standard Deviation (Sample) | 4.1% | 3.0% |
| Standard Deviation (Population) | 4.0% | 3.0% |
Similar Demographics by Disability Age 35 to 64
Demographics Similar to Immigrants from Trinidad and Tobago by Disability Age 35 to 64
In terms of disability age 35 to 64, the demographic groups most similar to Immigrants from Trinidad and Tobago are Italian (11.2%, a difference of 0.020%), Immigrants from Uganda (11.2%, a difference of 0.17%), Haitian (11.2%, a difference of 0.25%), Central American (11.2%, a difference of 0.26%), and Lebanese (11.3%, a difference of 0.34%).
| Demographics | Rating | Rank | Disability Age 35 to 64 |
| Pakistanis | 65.8 /100 | #164 | Good 11.1% |
| Immigrants | Western Europe | 65.2 /100 | #165 | Good 11.1% |
| Immigrants | Haiti | 63.8 /100 | #166 | Good 11.1% |
| Austrians | 63.2 /100 | #167 | Good 11.1% |
| Central Americans | 59.1 /100 | #168 | Average 11.2% |
| Haitians | 59.0 /100 | #169 | Average 11.2% |
| Immigrants | Uganda | 58.0 /100 | #170 | Average 11.2% |
| Immigrants | Trinidad and Tobago | 55.9 /100 | #171 | Average 11.2% |
| Italians | 55.6 /100 | #172 | Average 11.2% |
| Lebanese | 51.8 /100 | #173 | Average 11.3% |
| Immigrants | Fiji | 50.0 /100 | #174 | Average 11.3% |
| Czechs | 47.9 /100 | #175 | Average 11.3% |
| Ugandans | 43.7 /100 | #176 | Average 11.3% |
| Immigrants | Eastern Africa | 42.2 /100 | #177 | Average 11.3% |
| Poles | 42.0 /100 | #178 | Average 11.3% |
Demographics Similar to Immigrants from Iran by Disability Age 35 to 64
In terms of disability age 35 to 64, the demographic groups most similar to Immigrants from Iran are Thai (8.6%, a difference of 1.0%), Immigrants from Israel (8.6%, a difference of 1.4%), Iranian (8.7%, a difference of 2.0%), Immigrants from China (8.7%, a difference of 2.5%), and Immigrants from India (8.3%, a difference of 2.5%).
| Demographics | Rating | Rank | Disability Age 35 to 64 |
| Immigrants | Taiwan | 100.0 /100 | #1 | Exceptional 7.8% |
| Filipinos | 100.0 /100 | #2 | Exceptional 8.0% |
| Immigrants | Hong Kong | 100.0 /100 | #3 | Exceptional 8.2% |
| Immigrants | India | 100.0 /100 | #4 | Exceptional 8.3% |
| Immigrants | Iran | 100.0 /100 | #5 | Exceptional 8.5% |
| Thais | 100.0 /100 | #6 | Exceptional 8.6% |
| Immigrants | Israel | 100.0 /100 | #7 | Exceptional 8.6% |
| Iranians | 100.0 /100 | #8 | Exceptional 8.7% |
| Immigrants | China | 100.0 /100 | #9 | Exceptional 8.7% |
| Immigrants | Bolivia | 100.0 /100 | #10 | Exceptional 8.7% |
| Immigrants | Eastern Asia | 100.0 /100 | #11 | Exceptional 8.8% |
| Indians (Asian) | 100.0 /100 | #12 | Exceptional 8.9% |
| Immigrants | South Central Asia | 100.0 /100 | #13 | Exceptional 8.9% |
| Immigrants | Singapore | 100.0 /100 | #14 | Exceptional 8.9% |
| Bolivians | 100.0 /100 | #15 | Exceptional 8.9% |