Immigrants from Thailand vs Immigrants from Denmark Cognitive Disability
COMPARE
Immigrants from Thailand
Immigrants from Denmark
Cognitive Disability
Cognitive Disability Comparison
Immigrants from Thailand
Immigrants from Denmark
17.9%
COGNITIVE DISABILITY
0.8/ 100
METRIC RATING
246th/ 347
METRIC RANK
16.9%
COGNITIVE DISABILITY
96.2/ 100
METRIC RATING
118th/ 347
METRIC RANK
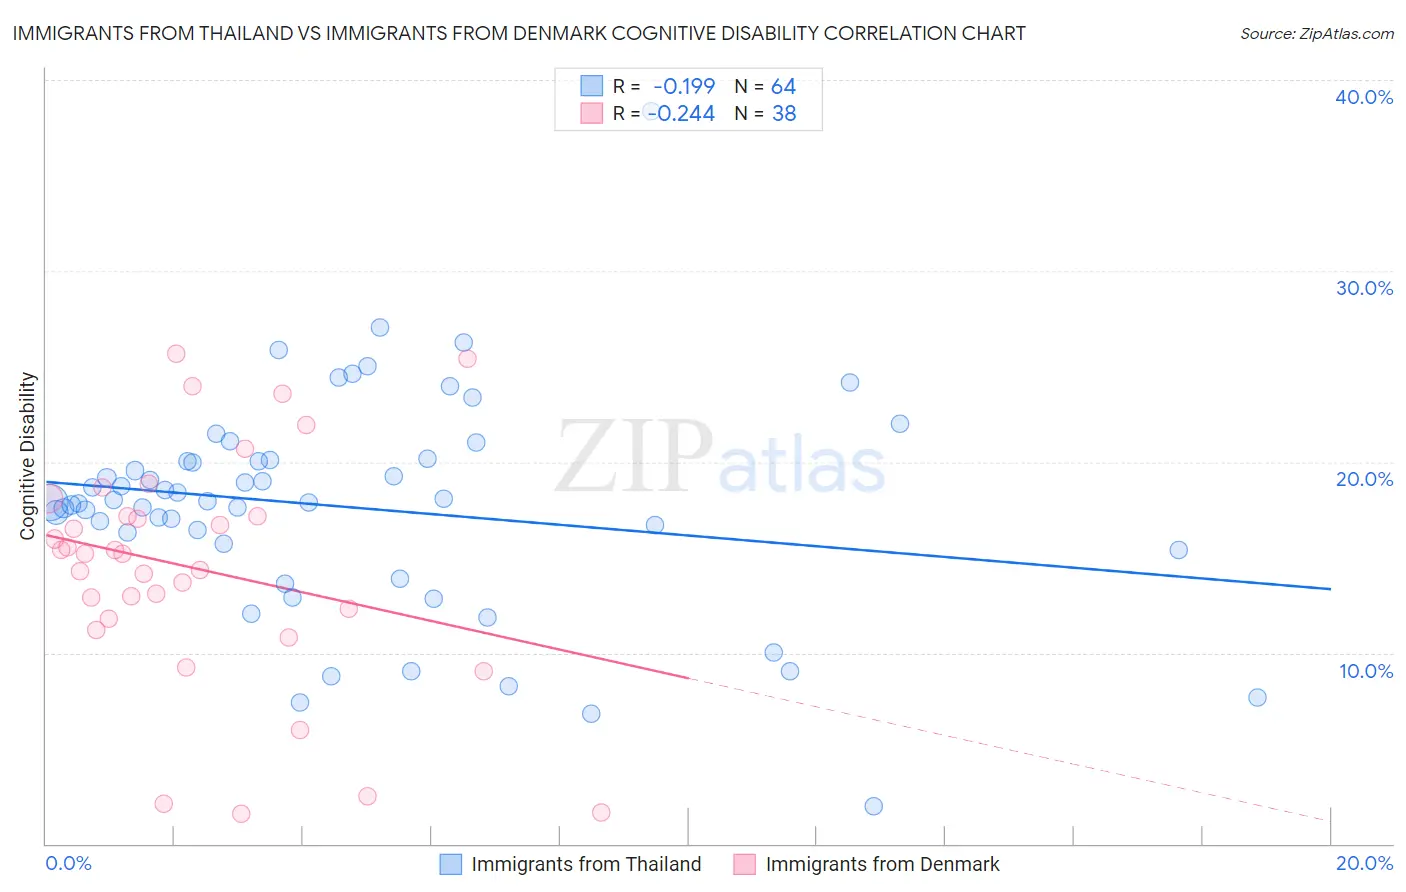
Immigrants from Thailand vs Immigrants from Denmark Cognitive Disability Correlation Chart
The statistical analysis conducted on geographies consisting of 316,987,546 people shows a poor negative correlation between the proportion of Immigrants from Thailand and percentage of population with cognitive disability in the United States with a correlation coefficient (R) of -0.199 and weighted average of 17.9%. Similarly, the statistical analysis conducted on geographies consisting of 136,432,525 people shows a weak negative correlation between the proportion of Immigrants from Denmark and percentage of population with cognitive disability in the United States with a correlation coefficient (R) of -0.244 and weighted average of 16.9%, a difference of 5.9%.
Cognitive Disability Correlation Summary
| Measurement | Immigrants from Thailand | Immigrants from Denmark |
| Minimum | 2.0% | 1.6% |
| Maximum | 38.4% | 25.6% |
| Range | 36.4% | 24.1% |
| Mean | 17.6% | 14.4% |
| Median | 17.9% | 15.2% |
| Interquartile 25% (IQ1) | 15.5% | 11.8% |
| Interquartile 75% (IQ3) | 20.1% | 17.2% |
| Interquartile Range (IQR) | 4.5% | 5.4% |
| Standard Deviation (Sample) | 5.8% | 6.1% |
| Standard Deviation (Population) | 5.8% | 6.1% |
Similar Demographics by Cognitive Disability
Demographics Similar to Immigrants from Thailand by Cognitive Disability
In terms of cognitive disability, the demographic groups most similar to Immigrants from Thailand are Trinidadian and Tobagonian (17.9%, a difference of 0.020%), Samoan (17.9%, a difference of 0.070%), French American Indian (17.9%, a difference of 0.080%), Jamaican (17.9%, a difference of 0.12%), and Cree (17.9%, a difference of 0.13%).
| Demographics | Rating | Rank | Cognitive Disability |
| Cajuns | 1.4 /100 | #239 | Tragic 17.8% |
| Iraqis | 1.4 /100 | #240 | Tragic 17.8% |
| Mexicans | 1.1 /100 | #241 | Tragic 17.8% |
| Paiute | 1.1 /100 | #242 | Tragic 17.8% |
| Immigrants | Bangladesh | 1.0 /100 | #243 | Tragic 17.8% |
| Jamaicans | 0.9 /100 | #244 | Tragic 17.9% |
| Trinidadians and Tobagonians | 0.8 /100 | #245 | Tragic 17.9% |
| Immigrants | Thailand | 0.8 /100 | #246 | Tragic 17.9% |
| Samoans | 0.7 /100 | #247 | Tragic 17.9% |
| French American Indians | 0.7 /100 | #248 | Tragic 17.9% |
| Cree | 0.7 /100 | #249 | Tragic 17.9% |
| Immigrants | Ethiopia | 0.7 /100 | #250 | Tragic 17.9% |
| Malaysians | 0.6 /100 | #251 | Tragic 17.9% |
| Immigrants | Grenada | 0.6 /100 | #252 | Tragic 17.9% |
| Hopi | 0.6 /100 | #253 | Tragic 17.9% |
Demographics Similar to Immigrants from Denmark by Cognitive Disability
In terms of cognitive disability, the demographic groups most similar to Immigrants from Denmark are Immigrants from Japan (16.9%, a difference of 0.010%), Inupiat (16.9%, a difference of 0.060%), South African (16.9%, a difference of 0.13%), Yup'ik (16.9%, a difference of 0.16%), and Immigrants from Sri Lanka (16.8%, a difference of 0.21%).
| Demographics | Rating | Rank | Cognitive Disability |
| Uruguayans | 97.2 /100 | #111 | Exceptional 16.8% |
| Indians (Asian) | 97.2 /100 | #112 | Exceptional 16.8% |
| Immigrants | Sri Lanka | 97.1 /100 | #113 | Exceptional 16.8% |
| Koreans | 97.1 /100 | #114 | Exceptional 16.8% |
| Yup'ik | 96.9 /100 | #115 | Exceptional 16.9% |
| Inupiat | 96.5 /100 | #116 | Exceptional 16.9% |
| Immigrants | Japan | 96.2 /100 | #117 | Exceptional 16.9% |
| Immigrants | Denmark | 96.2 /100 | #118 | Exceptional 16.9% |
| South Africans | 95.5 /100 | #119 | Exceptional 16.9% |
| Scottish | 95.0 /100 | #120 | Exceptional 16.9% |
| Immigrants | China | 94.9 /100 | #121 | Exceptional 16.9% |
| Immigrants | Western Europe | 94.8 /100 | #122 | Exceptional 16.9% |
| Portuguese | 94.7 /100 | #123 | Exceptional 16.9% |
| Turks | 94.5 /100 | #124 | Exceptional 16.9% |
| Scandinavians | 94.1 /100 | #125 | Exceptional 16.9% |