Immigrants from Taiwan vs Paraguayan Cognitive Disability
COMPARE
Immigrants from Taiwan
Paraguayan
Cognitive Disability
Cognitive Disability Comparison
Immigrants from Taiwan
Paraguayans
15.7%
COGNITIVE DISABILITY
100.0/ 100
METRIC RATING
1st/ 347
METRIC RANK
16.8%
COGNITIVE DISABILITY
98.0/ 100
METRIC RATING
103rd/ 347
METRIC RANK
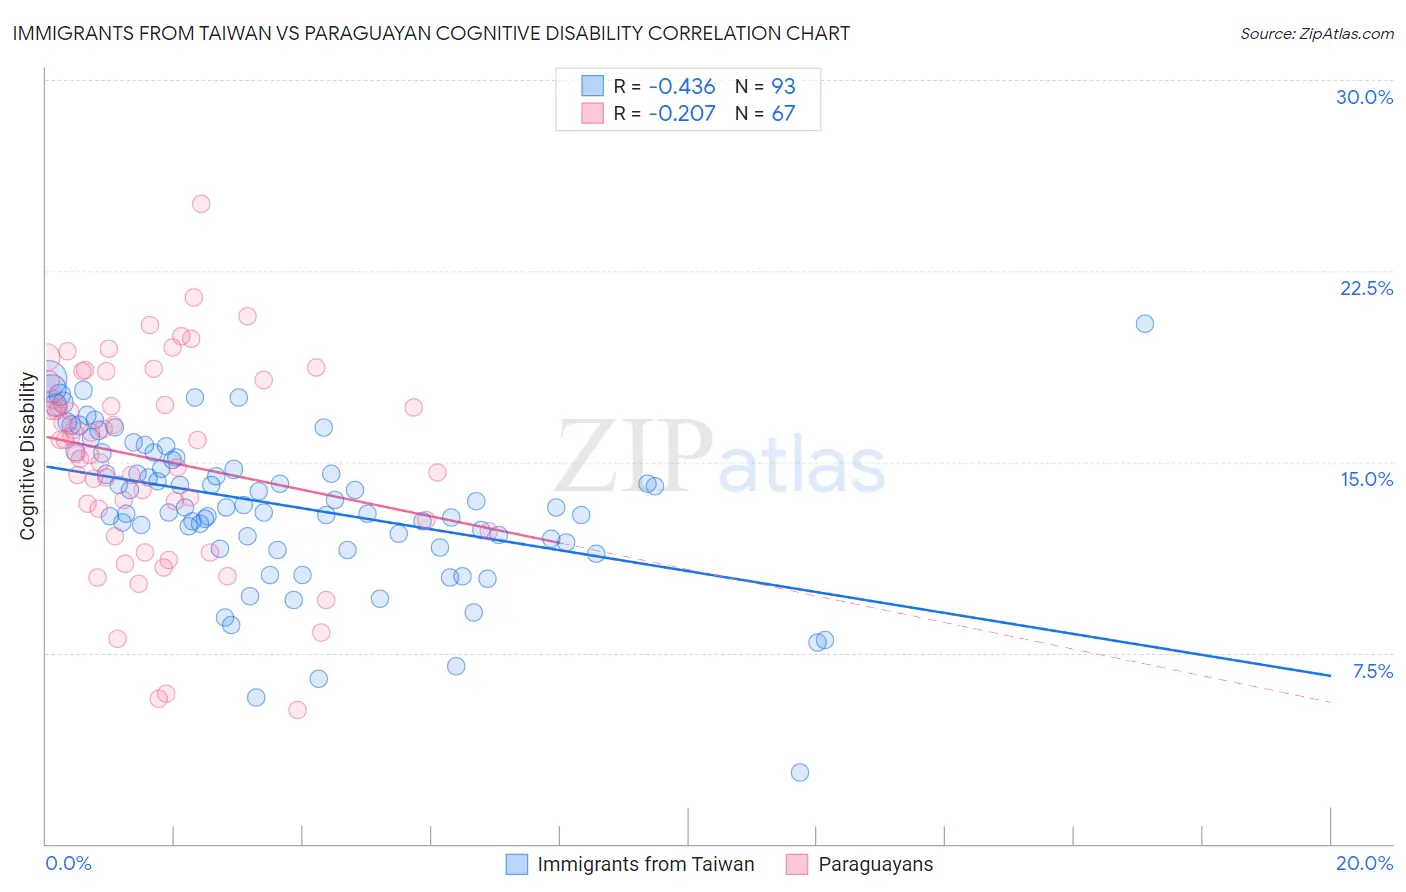
Immigrants from Taiwan vs Paraguayan Cognitive Disability Correlation Chart
The statistical analysis conducted on geographies consisting of 298,281,408 people shows a moderate negative correlation between the proportion of Immigrants from Taiwan and percentage of population with cognitive disability in the United States with a correlation coefficient (R) of -0.436 and weighted average of 15.7%. Similarly, the statistical analysis conducted on geographies consisting of 95,106,732 people shows a weak negative correlation between the proportion of Paraguayans and percentage of population with cognitive disability in the United States with a correlation coefficient (R) of -0.207 and weighted average of 16.8%, a difference of 6.9%.
Cognitive Disability Correlation Summary
| Measurement | Immigrants from Taiwan | Paraguayan |
| Minimum | 2.8% | 5.3% |
| Maximum | 20.4% | 25.1% |
| Range | 17.6% | 19.9% |
| Mean | 13.3% | 15.1% |
| Median | 13.2% | 15.9% |
| Interquartile 25% (IQ1) | 11.9% | 12.7% |
| Interquartile 75% (IQ3) | 15.4% | 18.2% |
| Interquartile Range (IQR) | 3.5% | 5.4% |
| Standard Deviation (Sample) | 3.0% | 3.9% |
| Standard Deviation (Population) | 3.0% | 3.9% |
Similar Demographics by Cognitive Disability
Demographics Similar to Immigrants from Taiwan by Cognitive Disability
In terms of cognitive disability, the demographic groups most similar to Immigrants from Taiwan are Immigrants from India (15.9%, a difference of 1.3%), Chinese (15.9%, a difference of 1.3%), Immigrants from Lithuania (16.0%, a difference of 1.5%), Immigrants from Hong Kong (16.0%, a difference of 1.9%), and Thai (16.1%, a difference of 2.6%).
| Demographics | Rating | Rank | Cognitive Disability |
| Immigrants | Taiwan | 100.0 /100 | #1 | Exceptional 15.7% |
| Immigrants | India | 100.0 /100 | #2 | Exceptional 15.9% |
| Chinese | 100.0 /100 | #3 | Exceptional 15.9% |
| Immigrants | Lithuania | 100.0 /100 | #4 | Exceptional 16.0% |
| Immigrants | Hong Kong | 100.0 /100 | #5 | Exceptional 16.0% |
| Thais | 100.0 /100 | #6 | Exceptional 16.1% |
| Immigrants | Ireland | 100.0 /100 | #7 | Exceptional 16.1% |
| Immigrants | Poland | 100.0 /100 | #8 | Exceptional 16.1% |
| Assyrians/Chaldeans/Syriacs | 100.0 /100 | #9 | Exceptional 16.2% |
| Immigrants | Scotland | 100.0 /100 | #10 | Exceptional 16.2% |
| Immigrants | Czechoslovakia | 100.0 /100 | #11 | Exceptional 16.2% |
| Maltese | 100.0 /100 | #12 | Exceptional 16.2% |
| Lithuanians | 100.0 /100 | #13 | Exceptional 16.3% |
| Immigrants | Austria | 100.0 /100 | #14 | Exceptional 16.3% |
| Immigrants | Greece | 100.0 /100 | #15 | Exceptional 16.3% |
Demographics Similar to Paraguayans by Cognitive Disability
In terms of cognitive disability, the demographic groups most similar to Paraguayans are Palestinian (16.8%, a difference of 0.0%), Immigrants from Eastern Asia (16.8%, a difference of 0.010%), Irish (16.8%, a difference of 0.050%), Northern European (16.8%, a difference of 0.050%), and Immigrants from Asia (16.8%, a difference of 0.070%).
| Demographics | Rating | Rank | Cognitive Disability |
| Finns | 98.5 /100 | #96 | Exceptional 16.8% |
| Dutch | 98.5 /100 | #97 | Exceptional 16.8% |
| Immigrants | Lebanon | 98.4 /100 | #98 | Exceptional 16.8% |
| Jordanians | 98.2 /100 | #99 | Exceptional 16.8% |
| Immigrants | Russia | 98.2 /100 | #100 | Exceptional 16.8% |
| Immigrants | Asia | 98.1 /100 | #101 | Exceptional 16.8% |
| Irish | 98.1 /100 | #102 | Exceptional 16.8% |
| Paraguayans | 98.0 /100 | #103 | Exceptional 16.8% |
| Palestinians | 98.0 /100 | #104 | Exceptional 16.8% |
| Immigrants | Eastern Asia | 97.9 /100 | #105 | Exceptional 16.8% |
| Northern Europeans | 97.8 /100 | #106 | Exceptional 16.8% |
| Immigrants | Nicaragua | 97.8 /100 | #107 | Exceptional 16.8% |
| Canadians | 97.5 /100 | #108 | Exceptional 16.8% |
| Albanians | 97.3 /100 | #109 | Exceptional 16.8% |
| Arapaho | 97.3 /100 | #110 | Exceptional 16.8% |