Immigrants from Taiwan vs Immigrants from Uzbekistan Hearing Disability
COMPARE
Immigrants from Taiwan
Immigrants from Uzbekistan
Hearing Disability
Hearing Disability Comparison
Immigrants from Taiwan
Immigrants from Uzbekistan
2.6%
HEARING DISABILITY
99.4/ 100
METRIC RATING
41st/ 347
METRIC RANK
2.7%
HEARING DISABILITY
98.4/ 100
METRIC RATING
61st/ 347
METRIC RANK
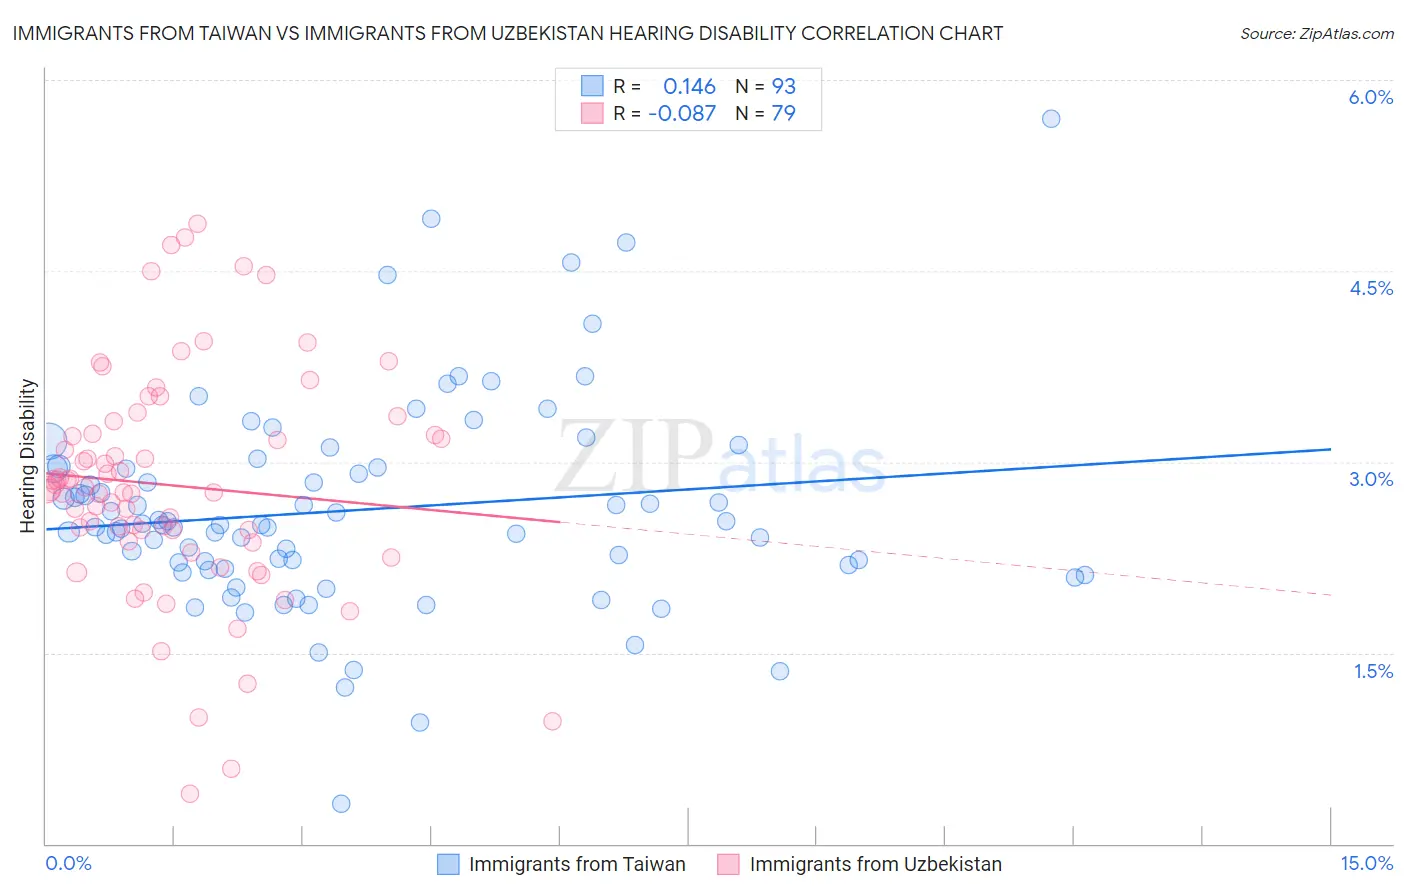
Immigrants from Taiwan vs Immigrants from Uzbekistan Hearing Disability Correlation Chart
The statistical analysis conducted on geographies consisting of 298,207,747 people shows a poor positive correlation between the proportion of Immigrants from Taiwan and percentage of population with hearing disability in the United States with a correlation coefficient (R) of 0.146 and weighted average of 2.6%. Similarly, the statistical analysis conducted on geographies consisting of 118,732,772 people shows a slight negative correlation between the proportion of Immigrants from Uzbekistan and percentage of population with hearing disability in the United States with a correlation coefficient (R) of -0.087 and weighted average of 2.7%, a difference of 2.6%.
Hearing Disability Correlation Summary
| Measurement | Immigrants from Taiwan | Immigrants from Uzbekistan |
| Minimum | 0.31% | 0.39% |
| Maximum | 5.7% | 4.9% |
| Range | 5.4% | 4.5% |
| Mean | 2.6% | 2.8% |
| Median | 2.5% | 2.8% |
| Interquartile 25% (IQ1) | 2.2% | 2.4% |
| Interquartile 75% (IQ3) | 3.0% | 3.2% |
| Interquartile Range (IQR) | 0.78% | 0.84% |
| Standard Deviation (Sample) | 0.82% | 0.89% |
| Standard Deviation (Population) | 0.82% | 0.88% |
Demographics Similar to Immigrants from Taiwan and Immigrants from Uzbekistan by Hearing Disability
In terms of hearing disability, the demographic groups most similar to Immigrants from Taiwan are West Indian (2.6%, a difference of 0.010%), Senegalese (2.6%, a difference of 0.010%), Nigerian (2.6%, a difference of 0.23%), Venezuelan (2.6%, a difference of 0.26%), and Immigrants from Dominica (2.6%, a difference of 0.36%). Similarly, the demographic groups most similar to Immigrants from Uzbekistan are Immigrants from Egypt (2.7%, a difference of 0.13%), Immigrants from Eritrea (2.7%, a difference of 0.20%), Immigrants from Peru (2.7%, a difference of 0.31%), South American (2.7%, a difference of 1.1%), and Immigrants from Nicaragua (2.7%, a difference of 1.1%).
| Demographics | Rating | Rank | Hearing Disability |
| Immigrants | Taiwan | 99.4 /100 | #41 | Exceptional 2.6% |
| West Indians | 99.4 /100 | #42 | Exceptional 2.6% |
| Senegalese | 99.4 /100 | #43 | Exceptional 2.6% |
| Nigerians | 99.4 /100 | #44 | Exceptional 2.6% |
| Venezuelans | 99.4 /100 | #45 | Exceptional 2.6% |
| Immigrants | Dominica | 99.3 /100 | #46 | Exceptional 2.6% |
| Immigrants | Israel | 99.3 /100 | #47 | Exceptional 2.6% |
| Immigrants | Singapore | 99.3 /100 | #48 | Exceptional 2.6% |
| Immigrants | South America | 99.2 /100 | #49 | Exceptional 2.7% |
| Paraguayans | 99.2 /100 | #50 | Exceptional 2.7% |
| Immigrants | Hong Kong | 99.2 /100 | #51 | Exceptional 2.7% |
| Jamaicans | 99.0 /100 | #52 | Exceptional 2.7% |
| Immigrants | Eastern Asia | 99.0 /100 | #53 | Exceptional 2.7% |
| Ethiopians | 99.0 /100 | #54 | Exceptional 2.7% |
| Immigrants | Ethiopia | 99.0 /100 | #55 | Exceptional 2.7% |
| Immigrants | Nicaragua | 99.0 /100 | #56 | Exceptional 2.7% |
| South Americans | 99.0 /100 | #57 | Exceptional 2.7% |
| Immigrants | Peru | 98.6 /100 | #58 | Exceptional 2.7% |
| Immigrants | Eritrea | 98.5 /100 | #59 | Exceptional 2.7% |
| Immigrants | Egypt | 98.5 /100 | #60 | Exceptional 2.7% |
| Immigrants | Uzbekistan | 98.4 /100 | #61 | Exceptional 2.7% |