Immigrants from Switzerland vs Inupiat Female Disability

COMPARE

Immigrants from Switzerland
Race
Ancestry
AfghanAfricanAlaska NativeAlaskan AthabascanAlbanianAleutAlsatianAmericanApacheArabArapahoArgentineanArmenianAssyrian/Chaldean/SyriacAustralianAustrianBahamianBangladeshiBarbadianBasqueBelgianBelizeanBermudanBhutaneseBlackfeetBolivianBrazilianBritishBritish West IndianBulgarianBurmeseCajunCambodianCanadianCape VerdeanCarpatho RusynCelticCentral AmericanCentral American IndianCherokeeCheyenneChickasawChileanChineseChippewaChoctawColombianColvilleComancheCosta RicanCreeCreekCroatianCrowCubanCypriotCzechCzechoslovakianDanishDelawareDominicanDutchDutch West IndianEastern EuropeanEcuadorianEgyptianEnglishEstonianEthiopianEuropeanFijianFilipinoFinnishFrenchFrench American IndianFrench CanadianGermanGerman RussianGhanaianGreekGuamanian/ChamorroGuatemalanGuyaneseHaitianHmongHonduranHopiHoumaHungarianIcelanderIndian (Asian)IndonesianIranianIraqiIrishIroquoisIsraeliItalianJamaicanJapaneseJordanianKenyanKiowaKoreanLaotianLatvianLebaneseLiberianLithuanianLumbeeLuxembourgerMacedonianMalaysianMalteseMarshalleseMenomineeMexicanMexican American IndianMongolianMoroccanNative HawaiianNavajoNepaleseNew ZealanderNicaraguanNigerianNorthern EuropeanNorwegianOkinawanOsageOttawaPaiutePakistaniPalestinianPanamanianParaguayanPennsylvania GermanPeruvianPimaPolishPortuguesePotawatomiPuebloPuerto RicanPuget Sound SalishRomanianRussianSalvadoranSamoanScandinavianScotch-IrishScottishSeminoleSenegaleseSerbianShoshoneSierra LeoneanSiouxSlavicSlovakSloveneSomaliSouth AfricanSouth AmericanSouth American IndianSoviet UnionSpaniardSpanishSpanish AmericanSpanish American IndianSri LankanSubsaharan AfricanSudaneseSwedishSwissSyrianTaiwaneseThaiTlingit-HaidaTohono O'OdhamTonganTrinidadian and TobagonianTsimshianTurkishU.S. Virgin IslanderUgandanUkrainianUruguayanUteVenezuelanVietnameseWelshWest IndianYakamaYaquiYugoslavianYumanYup'ikZimbabwean
Immigration
NonimmigrantsImmigrantsAfghanistanAfricaAlbaniaArgentinaArmeniaAsiaAustraliaAustriaBahamasBangladeshBarbadosBelarusBelgiumBelizeBoliviaBosnia and HerzegovinaBrazilBulgariaBurma/MyanmarCabo VerdeCambodiaCameroonCanadaCaribbeanCentral AmericaChileChinaColombiaCongoCosta RicaCroatiaCubaCzechoslovakiaDenmarkDominicaDominican RepublicEastern AfricaEastern AsiaEastern EuropeEcuadorEgyptEl SalvadorEnglandEritreaEthiopiaEuropeFijiFranceGermanyGhanaGreeceGrenadaGuatemalaGuyanaHaitiHondurasHong KongHungaryIndiaIndonesiaIranIraqIrelandIsraelItalyJamaicaJapanJordanKazakhstanKenyaKoreaKuwaitLaosLatin AmericaLatviaLebanonLiberiaLithuaniaMalaysiaMexicoMicronesiaMiddle AfricaMoldovaMoroccoNepalNetherlandsNicaraguaNigeriaNorth AmericaNorth MacedoniaNorthern AfricaNorthern EuropeNorwayOceaniaPakistanPanamaPeruPhilippinesPolandPortugalRomaniaRussiaSaudi ArabiaScotlandSenegalSerbiaSierra LeoneSingaporeSomaliaSouth AfricaSouth AmericaSouth Central AsiaSouth Eastern AsiaSouthern EuropeSpainSri LankaSt. Vincent and the GrenadinesSudanSwedenSwitzerlandSyriaTaiwanThailandTrinidad and TobagoTurkeyUgandaUkraineUruguayUzbekistanVenezuelaVietnamWest IndiesWestern AfricaWestern AsiaWestern EuropeYemenZaireZimbabweAzores
Inupiat
Race
Ancestry
AfghanAfricanAlaska NativeAlaskan AthabascanAlbanianAleutAlsatianAmericanApacheArabArapahoArgentineanArmenianAssyrian/Chaldean/SyriacAustralianAustrianBahamianBangladeshiBarbadianBasqueBelgianBelizeanBermudanBhutaneseBlackfeetBolivianBrazilianBritishBritish West IndianBulgarianBurmeseCajunCambodianCanadianCape VerdeanCarpatho RusynCelticCentral AmericanCentral American IndianCherokeeCheyenneChickasawChileanChineseChippewaChoctawColombianColvilleComancheCosta RicanCreeCreekCroatianCrowCubanCypriotCzechCzechoslovakianDanishDelawareDominicanDutchDutch West IndianEastern EuropeanEcuadorianEgyptianEnglishEstonianEthiopianEuropeanFijianFilipinoFinnishFrenchFrench American IndianFrench CanadianGermanGerman RussianGhanaianGreekGuamanian/ChamorroGuatemalanGuyaneseHaitianHmongHonduranHopiHoumaHungarianIcelanderIndian (Asian)IndonesianInupiatIranianIraqiIrishIroquoisIsraeliItalianJamaicanJapaneseJordanianKenyanKiowaKoreanLaotianLatvianLebaneseLiberianLithuanianLumbeeLuxembourgerMacedonianMalaysianMalteseMarshalleseMenomineeMexicanMexican American IndianMongolianMoroccanNative HawaiianNavajoNepaleseNew ZealanderNicaraguanNigerianNorthern EuropeanNorwegianOkinawanOsageOttawaPaiutePakistaniPalestinianPanamanianParaguayanPennsylvania GermanPeruvianPimaPolishPortuguesePotawatomiPuebloPuerto RicanPuget Sound SalishRomanianRussianSalvadoranSamoanScandinavianScotch-IrishScottishSeminoleSenegaleseSerbianShoshoneSierra LeoneanSiouxSlavicSlovakSloveneSomaliSouth AfricanSouth AmericanSouth American IndianSoviet UnionSpaniardSpanishSpanish AmericanSpanish American IndianSri LankanSubsaharan AfricanSudaneseSwedishSwissSyrianTaiwaneseThaiTlingit-HaidaTohono O'OdhamTonganTrinidadian and TobagonianTsimshianTurkishU.S. Virgin IslanderUgandanUkrainianUruguayanUteVenezuelanVietnameseWelshWest IndianYakamaYaquiYugoslavianYumanYup'ikZimbabwean
Immigration
NonimmigrantsImmigrantsAfghanistanAfricaAlbaniaArgentinaArmeniaAsiaAustraliaAustriaBahamasBangladeshBarbadosBelarusBelgiumBelizeBoliviaBosnia and HerzegovinaBrazilBulgariaBurma/MyanmarCabo VerdeCambodiaCameroonCanadaCaribbeanCentral AmericaChileChinaColombiaCongoCosta RicaCroatiaCubaCzechoslovakiaDenmarkDominicaDominican RepublicEastern AfricaEastern AsiaEastern EuropeEcuadorEgyptEl SalvadorEnglandEritreaEthiopiaEuropeFijiFranceGermanyGhanaGreeceGrenadaGuatemalaGuyanaHaitiHondurasHong KongHungaryIndiaIndonesiaIranIraqIrelandIsraelItalyJamaicaJapanJordanKazakhstanKenyaKoreaKuwaitLaosLatin AmericaLatviaLebanonLiberiaLithuaniaMalaysiaMexicoMicronesiaMiddle AfricaMoldovaMoroccoNepalNetherlandsNicaraguaNigeriaNorth AmericaNorth MacedoniaNorthern AfricaNorthern EuropeNorwayOceaniaPakistanPanamaPeruPhilippinesPolandPortugalRomaniaRussiaSaudi ArabiaScotlandSenegalSerbiaSierra LeoneSingaporeSomaliaSouth AfricaSouth AmericaSouth Central AsiaSouth Eastern AsiaSouthern EuropeSpainSri LankaSt. Vincent and the GrenadinesSudanSwedenSyriaTaiwanThailandTrinidad and TobagoTurkeyUgandaUkraineUruguayUzbekistanVenezuelaVietnamWest IndiesWestern AfricaWestern AsiaWestern EuropeYemenZaireZimbabweAzores
Female Disability
Income
Poverty
Unemployment
Labor Participation
Family Structure
Vehicle Availability
Education Level
Disability

Female Disability Comparison

Immigrants from Switzerland

Inupiat

Exceptional
Exceptional
11.5%
FEMALE DISABILITY
99.8/ 100
METRIC RATING
73rd/ 347
METRIC RANK
11.3%
FEMALE DISABILITY
100.0/ 100
METRIC RATING
50th/ 347
METRIC RANK

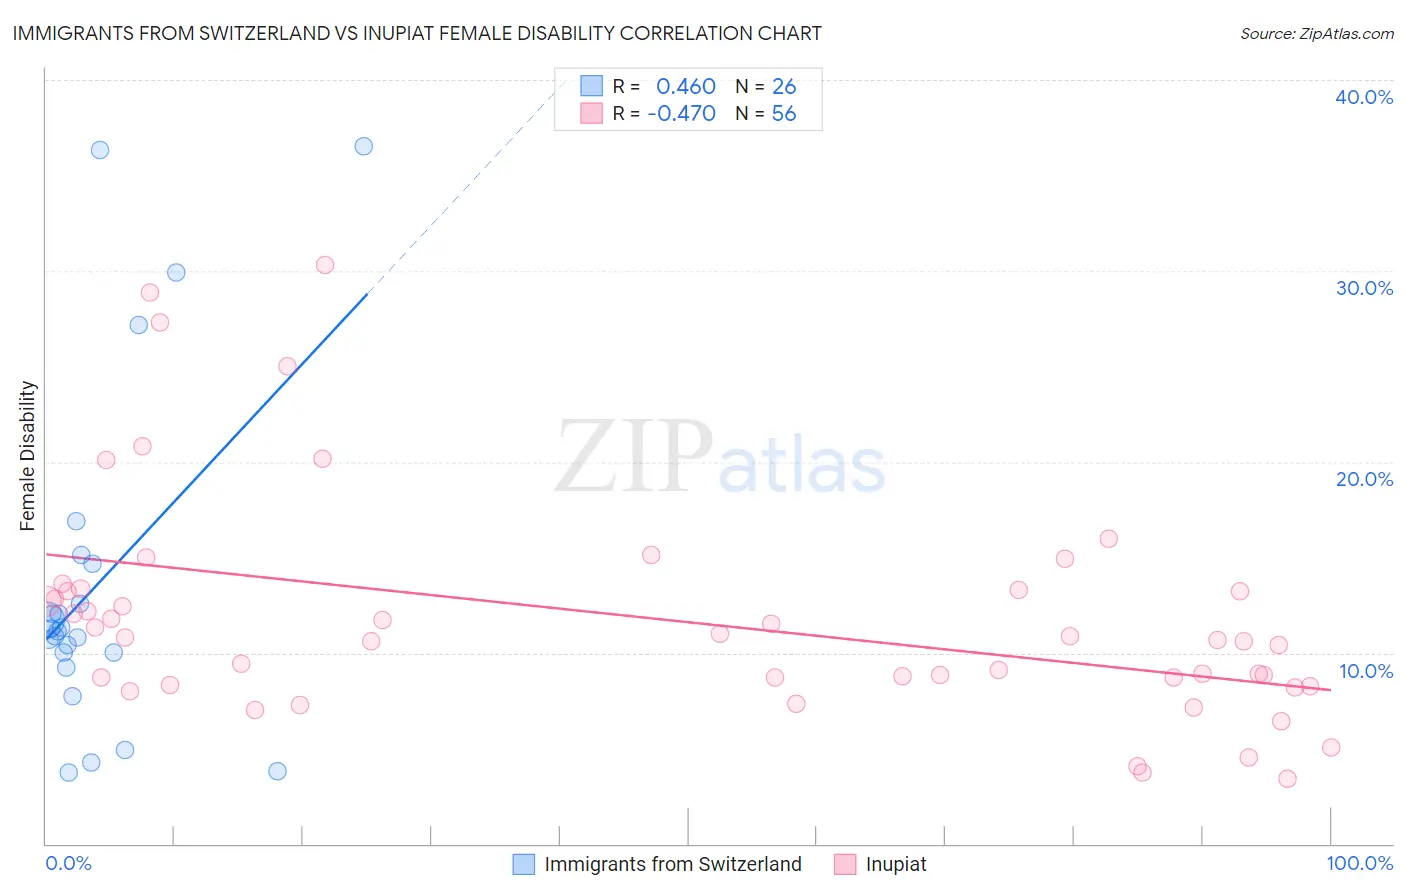
Immigrants from Switzerland vs Inupiat Female Disability Correlation Chart

The statistical analysis conducted on geographies consisting of 148,080,197 people shows a moderate positive correlation between the proportion of Immigrants from Switzerland and percentage of females with a disability in the United States with a correlation coefficient (R) of 0.460 and weighted average of 11.5%. Similarly, the statistical analysis conducted on geographies consisting of 96,332,490 people shows a moderate negative correlation between the proportion of Inupiat and percentage of females with a disability in the United States with a correlation coefficient (R) of -0.470 and weighted average of 11.3%, a difference of 1.7%.
Immigrants from Switzerland vs Inupiat Female Disability

Female Disability Correlation Summary

MeasurementImmigrants from SwitzerlandInupiat
Minimum3.7%3.4%
Maximum36.5%30.3%
Range32.8%26.9%
Mean13.7%11.8%
Median11.2%10.7%
Interquartile 25% (IQ1)10.0%8.5%
Interquartile 75% (IQ3)14.6%13.3%
Interquartile Range (IQR)4.6%4.8%
Standard Deviation (Sample)8.9%5.9%
Standard Deviation (Population)8.8%5.8%

Similar Demographics by Female Disability

Demographics Similar to Immigrants from Switzerland by Female Disability

In terms of female disability, the demographic groups most similar to Immigrants from Switzerland are Chilean (11.5%, a difference of 0.020%), Immigrants from Ireland (11.5%, a difference of 0.080%), Bhutanese (11.5%, a difference of 0.080%), Immigrants from Chile (11.5%, a difference of 0.13%), and Colombian (11.5%, a difference of 0.14%).
DemographicsRating | RankFemale Disability
Salvadorans
99.8
/100
|
#66
Exceptional
11.5%
Immigrants | Vietnam
99.8
/100
|
#67
Exceptional
11.5%
Immigrants | Northern Africa
99.8
/100
|
#68
Exceptional
11.5%
Colombians
99.8
/100
|
#69
Exceptional
11.5%
Immigrants | Chile
99.8
/100
|
#70
Exceptional
11.5%
Immigrants | Ireland
99.8
/100
|
#71
Exceptional
11.5%
Chileans
99.8
/100
|
#72
Exceptional
11.5%
Immigrants | Switzerland
99.8
/100
|
#73
Exceptional
11.5%
Bhutanese
99.8
/100
|
#74
Exceptional
11.5%
Immigrants | Lebanon
99.7
/100
|
#75
Exceptional
11.5%
Immigrants | Eritrea
99.7
/100
|
#76
Exceptional
11.5%
Immigrants | Afghanistan
99.7
/100
|
#77
Exceptional
11.5%
Immigrants | South Africa
99.7
/100
|
#78
Exceptional
11.5%
Sierra Leoneans
99.7
/100
|
#79
Exceptional
11.5%
Immigrants | Jordan
99.7
/100
|
#80
Exceptional
11.5%

Demographics Similar to Inupiat by Female Disability

In terms of female disability, the demographic groups most similar to Inupiat are Immigrants from Belgium (11.3%, a difference of 0.080%), Immigrants from Peru (11.3%, a difference of 0.20%), Tongan (11.3%, a difference of 0.23%), Jordanian (11.3%, a difference of 0.24%), and Zimbabwean (11.3%, a difference of 0.24%).
DemographicsRating | RankFemale Disability
Afghans
100.0
/100
|
#43
Exceptional
11.2%
Cambodians
100.0
/100
|
#44
Exceptional
11.3%
Immigrants | Sweden
100.0
/100
|
#45
Exceptional
11.3%
Immigrants | Nepal
100.0
/100
|
#46
Exceptional
11.3%
Jordanians
100.0
/100
|
#47
Exceptional
11.3%
Zimbabweans
100.0
/100
|
#48
Exceptional
11.3%
Tongans
100.0
/100
|
#49
Exceptional
11.3%
Inupiat
100.0
/100
|
#50
Exceptional
11.3%
Immigrants | Belgium
100.0
/100
|
#51
Exceptional
11.3%
Immigrants | Peru
99.9
/100
|
#52
Exceptional
11.3%
Immigrants | Saudi Arabia
99.9
/100
|
#53
Exceptional
11.3%
Peruvians
99.9
/100
|
#54
Exceptional
11.3%
Bulgarians
99.9
/100
|
#55
Exceptional
11.3%
Taiwanese
99.9
/100
|
#56
Exceptional
11.4%
South Americans
99.9
/100
|
#57
Exceptional
11.4%