Immigrants from Sweden vs Venezuelan Vision Disability
COMPARE
Immigrants from Sweden
Venezuelan
Vision Disability
Vision Disability Comparison
Immigrants from Sweden
Venezuelans
2.0%
VISION DISABILITY
99.7/ 100
METRIC RATING
46th/ 347
METRIC RANK
2.1%
VISION DISABILITY
87.2/ 100
METRIC RATING
134th/ 347
METRIC RANK
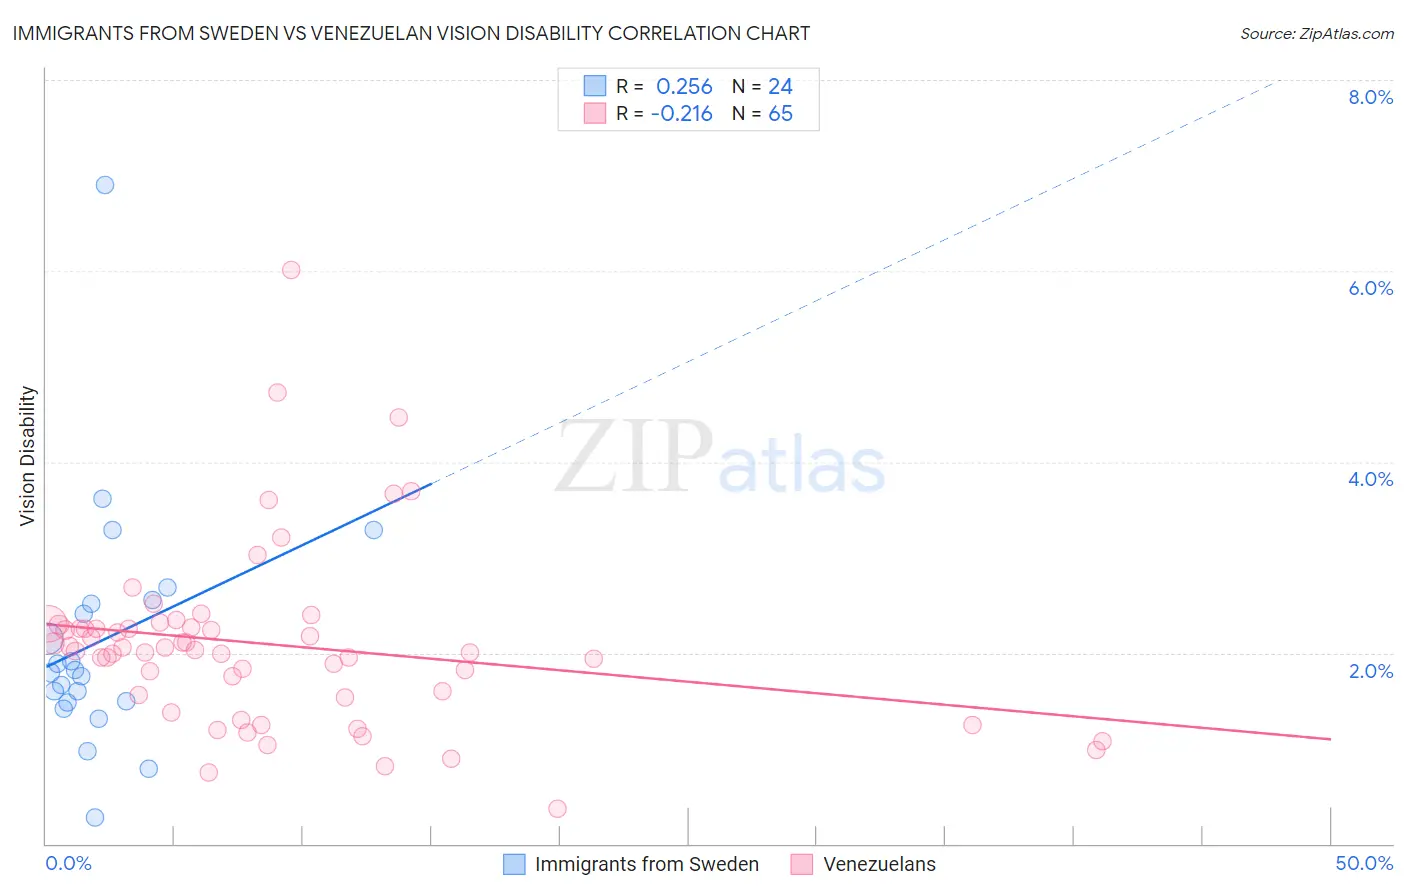
Immigrants from Sweden vs Venezuelan Vision Disability Correlation Chart
The statistical analysis conducted on geographies consisting of 164,685,810 people shows a weak positive correlation between the proportion of Immigrants from Sweden and percentage of population with vision disability in the United States with a correlation coefficient (R) of 0.256 and weighted average of 2.0%. Similarly, the statistical analysis conducted on geographies consisting of 306,200,633 people shows a weak negative correlation between the proportion of Venezuelans and percentage of population with vision disability in the United States with a correlation coefficient (R) of -0.216 and weighted average of 2.1%, a difference of 6.5%.
Vision Disability Correlation Summary
| Measurement | Immigrants from Sweden | Venezuelan |
| Minimum | 0.27% | 0.36% |
| Maximum | 6.9% | 6.0% |
| Range | 6.6% | 5.6% |
| Mean | 2.1% | 2.1% |
| Median | 1.8% | 2.0% |
| Interquartile 25% (IQ1) | 1.5% | 1.5% |
| Interquartile 75% (IQ3) | 2.5% | 2.3% |
| Interquartile Range (IQR) | 1.1% | 0.73% |
| Standard Deviation (Sample) | 1.3% | 0.94% |
| Standard Deviation (Population) | 1.3% | 0.94% |
Similar Demographics by Vision Disability
Demographics Similar to Immigrants from Sweden by Vision Disability
In terms of vision disability, the demographic groups most similar to Immigrants from Sweden are Immigrants from Bulgaria (2.0%, a difference of 0.020%), Ethiopian (2.0%, a difference of 0.040%), Immigrants from Indonesia (2.0%, a difference of 0.070%), Eastern European (2.0%, a difference of 0.090%), and Immigrants from Ethiopia (2.0%, a difference of 0.15%).
| Demographics | Rating | Rank | Vision Disability |
| Zimbabweans | 99.7 /100 | #39 | Exceptional 2.0% |
| Immigrants | Ireland | 99.7 /100 | #40 | Exceptional 2.0% |
| Cypriots | 99.7 /100 | #41 | Exceptional 2.0% |
| Immigrants | Ethiopia | 99.7 /100 | #42 | Exceptional 2.0% |
| Eastern Europeans | 99.7 /100 | #43 | Exceptional 2.0% |
| Immigrants | Indonesia | 99.7 /100 | #44 | Exceptional 2.0% |
| Ethiopians | 99.7 /100 | #45 | Exceptional 2.0% |
| Immigrants | Sweden | 99.7 /100 | #46 | Exceptional 2.0% |
| Immigrants | Bulgaria | 99.7 /100 | #47 | Exceptional 2.0% |
| Israelis | 99.6 /100 | #48 | Exceptional 2.0% |
| Latvians | 99.5 /100 | #49 | Exceptional 2.0% |
| Afghans | 99.5 /100 | #50 | Exceptional 2.0% |
| Tongans | 99.5 /100 | #51 | Exceptional 2.0% |
| Immigrants | Serbia | 99.4 /100 | #52 | Exceptional 2.0% |
| Immigrants | Belarus | 99.3 /100 | #53 | Exceptional 2.0% |
Demographics Similar to Venezuelans by Vision Disability
In terms of vision disability, the demographic groups most similar to Venezuelans are Syrian (2.1%, a difference of 0.050%), Vietnamese (2.1%, a difference of 0.070%), Czech (2.1%, a difference of 0.12%), Immigrants from South Eastern Asia (2.1%, a difference of 0.12%), and Arab (2.1%, a difference of 0.13%).
| Demographics | Rating | Rank | Vision Disability |
| Sudanese | 89.2 /100 | #127 | Excellent 2.1% |
| Immigrants | Chile | 89.0 /100 | #128 | Excellent 2.1% |
| Immigrants | Cameroon | 88.8 /100 | #129 | Excellent 2.1% |
| Immigrants | Kenya | 88.7 /100 | #130 | Excellent 2.1% |
| Immigrants | Hungary | 88.7 /100 | #131 | Excellent 2.1% |
| New Zealanders | 88.2 /100 | #132 | Excellent 2.1% |
| Syrians | 87.5 /100 | #133 | Excellent 2.1% |
| Venezuelans | 87.2 /100 | #134 | Excellent 2.1% |
| Vietnamese | 86.7 /100 | #135 | Excellent 2.1% |
| Czechs | 86.3 /100 | #136 | Excellent 2.1% |
| Immigrants | South Eastern Asia | 86.3 /100 | #137 | Excellent 2.1% |
| Arabs | 86.3 /100 | #138 | Excellent 2.1% |
| Immigrants | Morocco | 85.2 /100 | #139 | Excellent 2.1% |
| Immigrants | Netherlands | 84.2 /100 | #140 | Excellent 2.1% |
| Sierra Leoneans | 84.1 /100 | #141 | Excellent 2.1% |