Immigrants from Sweden vs Immigrants from India Disability Age 65 to 74
COMPARE
Immigrants from Sweden
Immigrants from India
Disability Age 65 to 74
Disability Age 65 to 74 Comparison
Immigrants from Sweden
Immigrants from India
21.0%
DISABILITY AGE 65 TO 74
99.9/ 100
METRIC RATING
27th/ 347
METRIC RANK
19.7%
DISABILITY AGE 65 TO 74
100.0/ 100
METRIC RATING
3rd/ 347
METRIC RANK
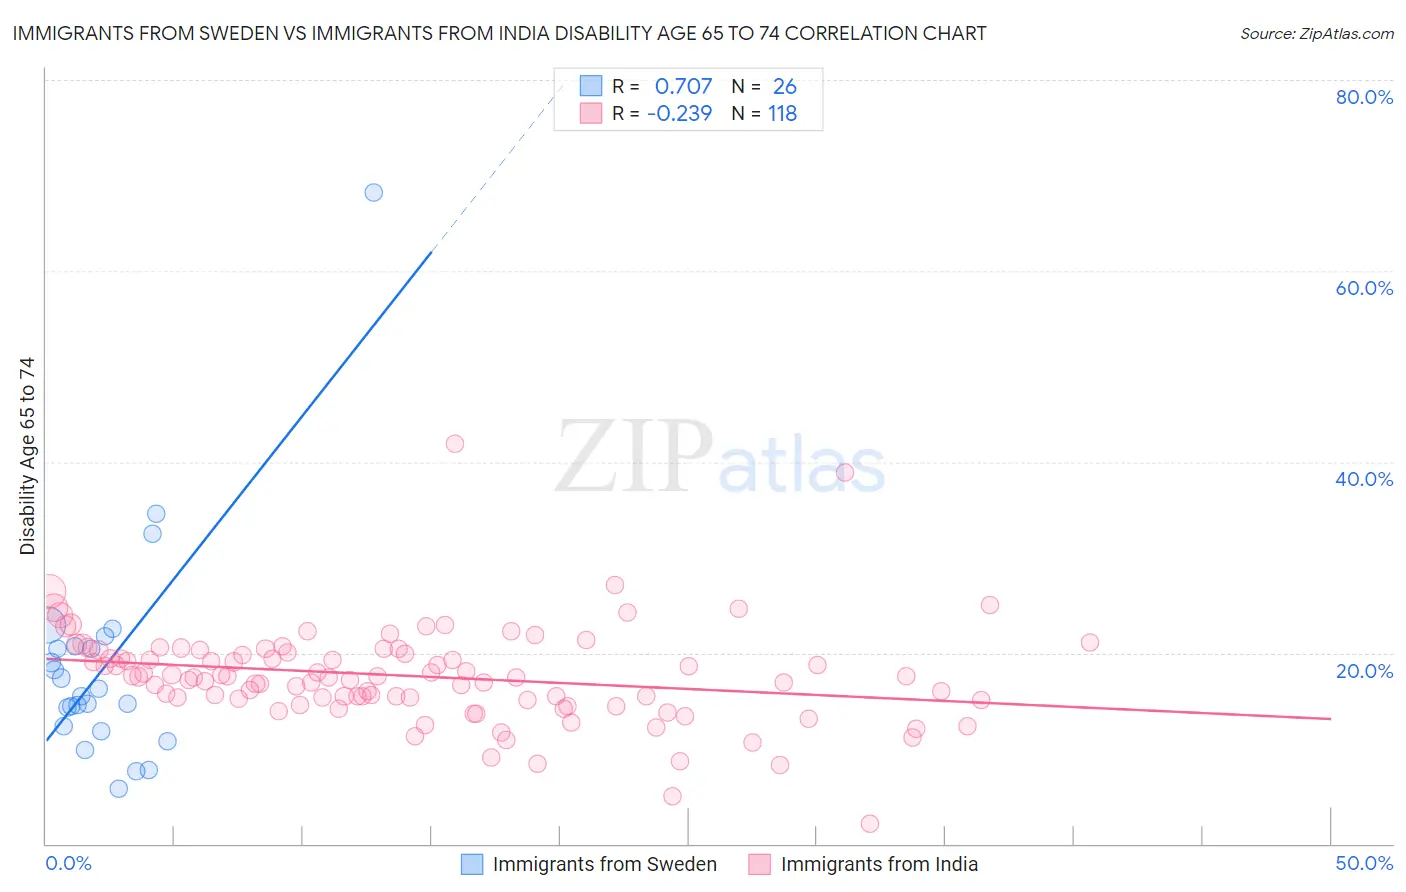
Immigrants from Sweden vs Immigrants from India Disability Age 65 to 74 Correlation Chart
The statistical analysis conducted on geographies consisting of 164,619,095 people shows a strong positive correlation between the proportion of Immigrants from Sweden and percentage of population with a disability between the ages 65 and 75 in the United States with a correlation coefficient (R) of 0.707 and weighted average of 21.0%. Similarly, the statistical analysis conducted on geographies consisting of 433,184,211 people shows a weak negative correlation between the proportion of Immigrants from India and percentage of population with a disability between the ages 65 and 75 in the United States with a correlation coefficient (R) of -0.239 and weighted average of 19.7%, a difference of 6.5%.
Disability Age 65 to 74 Correlation Summary
| Measurement | Immigrants from Sweden | Immigrants from India |
| Minimum | 5.7% | 2.1% |
| Maximum | 68.2% | 41.9% |
| Range | 62.5% | 39.8% |
| Mean | 18.8% | 17.6% |
| Median | 15.8% | 17.5% |
| Interquartile 25% (IQ1) | 12.3% | 15.1% |
| Interquartile 75% (IQ3) | 20.7% | 20.3% |
| Interquartile Range (IQR) | 8.4% | 5.2% |
| Standard Deviation (Sample) | 12.2% | 5.2% |
| Standard Deviation (Population) | 11.9% | 5.2% |
Similar Demographics by Disability Age 65 to 74
Demographics Similar to Immigrants from Sweden by Disability Age 65 to 74
In terms of disability age 65 to 74, the demographic groups most similar to Immigrants from Sweden are Immigrants from Australia (21.0%, a difference of 0.020%), Bolivian (21.0%, a difference of 0.030%), Soviet Union (21.0%, a difference of 0.080%), Immigrants from Czechoslovakia (21.0%, a difference of 0.10%), and Immigrants from Belgium (21.0%, a difference of 0.12%).
| Demographics | Rating | Rank | Disability Age 65 to 74 |
| Okinawans | 100.0 /100 | #20 | Exceptional 20.7% |
| Immigrants | Bolivia | 99.9 /100 | #21 | Exceptional 20.8% |
| Immigrants | Iran | 99.9 /100 | #22 | Exceptional 20.9% |
| Immigrants | Belgium | 99.9 /100 | #23 | Exceptional 21.0% |
| Soviet Union | 99.9 /100 | #24 | Exceptional 21.0% |
| Bolivians | 99.9 /100 | #25 | Exceptional 21.0% |
| Immigrants | Australia | 99.9 /100 | #26 | Exceptional 21.0% |
| Immigrants | Sweden | 99.9 /100 | #27 | Exceptional 21.0% |
| Immigrants | Czechoslovakia | 99.9 /100 | #28 | Exceptional 21.0% |
| Immigrants | Japan | 99.9 /100 | #29 | Exceptional 21.0% |
| Immigrants | Greece | 99.9 /100 | #30 | Exceptional 21.0% |
| Immigrants | Northern Europe | 99.9 /100 | #31 | Exceptional 21.0% |
| Turks | 99.9 /100 | #32 | Exceptional 21.0% |
| Immigrants | Argentina | 99.9 /100 | #33 | Exceptional 21.1% |
| Immigrants | Sri Lanka | 99.9 /100 | #34 | Exceptional 21.1% |
Demographics Similar to Immigrants from India by Disability Age 65 to 74
In terms of disability age 65 to 74, the demographic groups most similar to Immigrants from India are Immigrants from Hong Kong (19.9%, a difference of 0.84%), Immigrants from Israel (19.9%, a difference of 1.1%), Iranian (19.9%, a difference of 1.3%), Cypriot (20.1%, a difference of 1.9%), and Thai (20.1%, a difference of 2.0%).
| Demographics | Rating | Rank | Disability Age 65 to 74 |
| Immigrants | Taiwan | 100.0 /100 | #1 | Exceptional 18.8% |
| Filipinos | 100.0 /100 | #2 | Exceptional 19.0% |
| Immigrants | India | 100.0 /100 | #3 | Exceptional 19.7% |
| Immigrants | Hong Kong | 100.0 /100 | #4 | Exceptional 19.9% |
| Immigrants | Israel | 100.0 /100 | #5 | Exceptional 19.9% |
| Iranians | 100.0 /100 | #6 | Exceptional 19.9% |
| Cypriots | 100.0 /100 | #7 | Exceptional 20.1% |
| Thais | 100.0 /100 | #8 | Exceptional 20.1% |
| Immigrants | China | 100.0 /100 | #9 | Exceptional 20.3% |
| Immigrants | Eastern Asia | 100.0 /100 | #10 | Exceptional 20.3% |
| Immigrants | Ireland | 100.0 /100 | #11 | Exceptional 20.3% |
| Immigrants | Korea | 100.0 /100 | #12 | Exceptional 20.4% |
| Immigrants | Singapore | 100.0 /100 | #13 | Exceptional 20.4% |
| Indians (Asian) | 100.0 /100 | #14 | Exceptional 20.5% |
| Paraguayans | 100.0 /100 | #15 | Exceptional 20.5% |