Immigrants from Sudan vs Immigrants from Uganda Disability Age 18 to 34
COMPARE
Immigrants from Sudan
Immigrants from Uganda
Disability Age 18 to 34
Disability Age 18 to 34 Comparison
Immigrants from Sudan
Immigrants from Uganda
6.7%
DISABILITY AGE 18 TO 34
24.9/ 100
METRIC RATING
194th/ 347
METRIC RANK
6.7%
DISABILITY AGE 18 TO 34
25.1/ 100
METRIC RATING
193rd/ 347
METRIC RANK
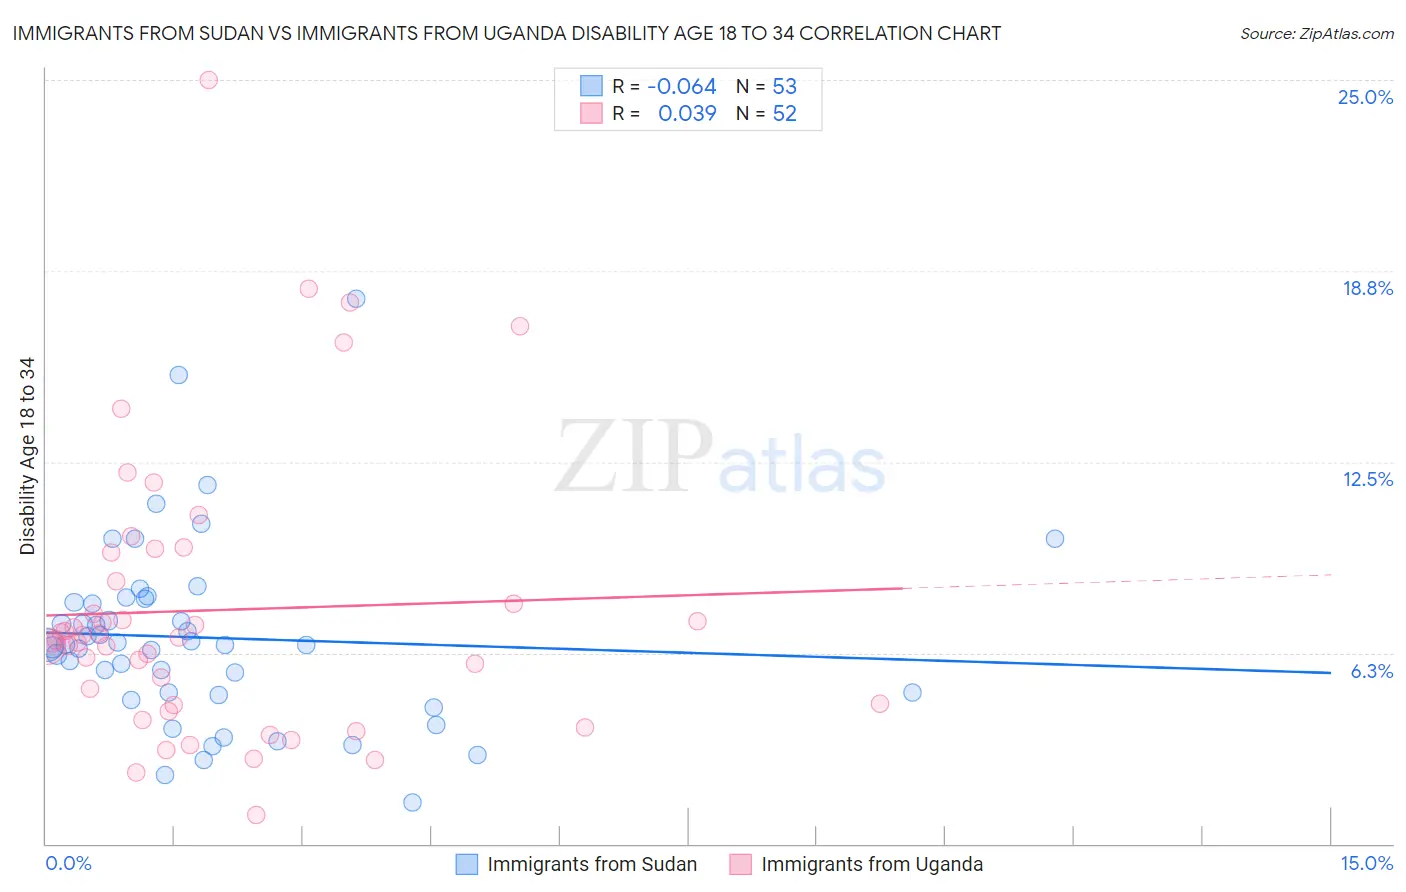
Immigrants from Sudan vs Immigrants from Uganda Disability Age 18 to 34 Correlation Chart
The statistical analysis conducted on geographies consisting of 118,941,653 people shows a slight negative correlation between the proportion of Immigrants from Sudan and percentage of population with a disability between the ages 18 and 35 in the United States with a correlation coefficient (R) of -0.064 and weighted average of 6.7%. Similarly, the statistical analysis conducted on geographies consisting of 125,934,575 people shows no correlation between the proportion of Immigrants from Uganda and percentage of population with a disability between the ages 18 and 35 in the United States with a correlation coefficient (R) of 0.039 and weighted average of 6.7%, a difference of 0.020%.
Disability Age 18 to 34 Correlation Summary
| Measurement | Immigrants from Sudan | Immigrants from Uganda |
| Minimum | 1.4% | 0.93% |
| Maximum | 17.8% | 25.0% |
| Range | 16.5% | 24.1% |
| Mean | 6.7% | 7.6% |
| Median | 6.5% | 6.7% |
| Interquartile 25% (IQ1) | 4.9% | 4.6% |
| Interquartile 75% (IQ3) | 8.0% | 9.1% |
| Interquartile Range (IQR) | 3.1% | 4.5% |
| Standard Deviation (Sample) | 3.0% | 4.6% |
| Standard Deviation (Population) | 3.0% | 4.6% |
Demographics Similar to Immigrants from Sudan and Immigrants from Uganda by Disability Age 18 to 34
In terms of disability age 18 to 34, the demographic groups most similar to Immigrants from Sudan are Mexican American Indian (6.7%, a difference of 0.25%), Immigrants from Western Africa (6.7%, a difference of 0.29%), Immigrants from Netherlands (6.7%, a difference of 0.38%), Estonian (6.8%, a difference of 0.41%), and Australian (6.8%, a difference of 0.54%). Similarly, the demographic groups most similar to Immigrants from Uganda are Immigrants from Western Africa (6.7%, a difference of 0.27%), Mexican American Indian (6.7%, a difference of 0.27%), Immigrants from Netherlands (6.7%, a difference of 0.40%), Estonian (6.8%, a difference of 0.43%), and Australian (6.8%, a difference of 0.56%).
| Demographics | Rating | Rank | Disability Age 18 to 34 |
| Immigrants | Iraq | 37.4 /100 | #183 | Fair 6.7% |
| Iraqis | 37.4 /100 | #184 | Fair 6.7% |
| Immigrants | Oceania | 35.4 /100 | #185 | Fair 6.7% |
| Yup'ik | 35.3 /100 | #186 | Fair 6.7% |
| Maltese | 34.8 /100 | #187 | Fair 6.7% |
| Immigrants | Cameroon | 34.5 /100 | #188 | Fair 6.7% |
| Pakistanis | 33.7 /100 | #189 | Fair 6.7% |
| Immigrants | Zimbabwe | 33.6 /100 | #190 | Fair 6.7% |
| Immigrants | Eastern Africa | 33.2 /100 | #191 | Fair 6.7% |
| Immigrants | Western Africa | 28.3 /100 | #192 | Fair 6.7% |
| Immigrants | Uganda | 25.1 /100 | #193 | Fair 6.7% |
| Immigrants | Sudan | 24.9 /100 | #194 | Fair 6.7% |
| Mexican American Indians | 22.3 /100 | #195 | Fair 6.7% |
| Immigrants | Netherlands | 21.0 /100 | #196 | Fair 6.7% |
| Estonians | 20.6 /100 | #197 | Fair 6.8% |
| Australians | 19.4 /100 | #198 | Poor 6.8% |
| Kenyans | 18.3 /100 | #199 | Poor 6.8% |
| Sierra Leoneans | 17.5 /100 | #200 | Poor 6.8% |
| Greeks | 16.1 /100 | #201 | Poor 6.8% |
| Panamanians | 15.8 /100 | #202 | Poor 6.8% |
| Hispanics or Latinos | 13.8 /100 | #203 | Poor 6.8% |