Immigrants from St. Vincent and the Grenadines vs Immigrants from Pakistan Disability Age 18 to 34
COMPARE
Immigrants from St. Vincent and the Grenadines
Immigrants from Pakistan
Disability Age 18 to 34
Disability Age 18 to 34 Comparison
Immigrants from St. Vincent and the Grenadines
Immigrants from Pakistan
5.5%
DISABILITY AGE 18 TO 34
100.0/ 100
METRIC RATING
12th/ 347
METRIC RANK
5.8%
DISABILITY AGE 18 TO 34
99.9/ 100
METRIC RATING
30th/ 347
METRIC RANK
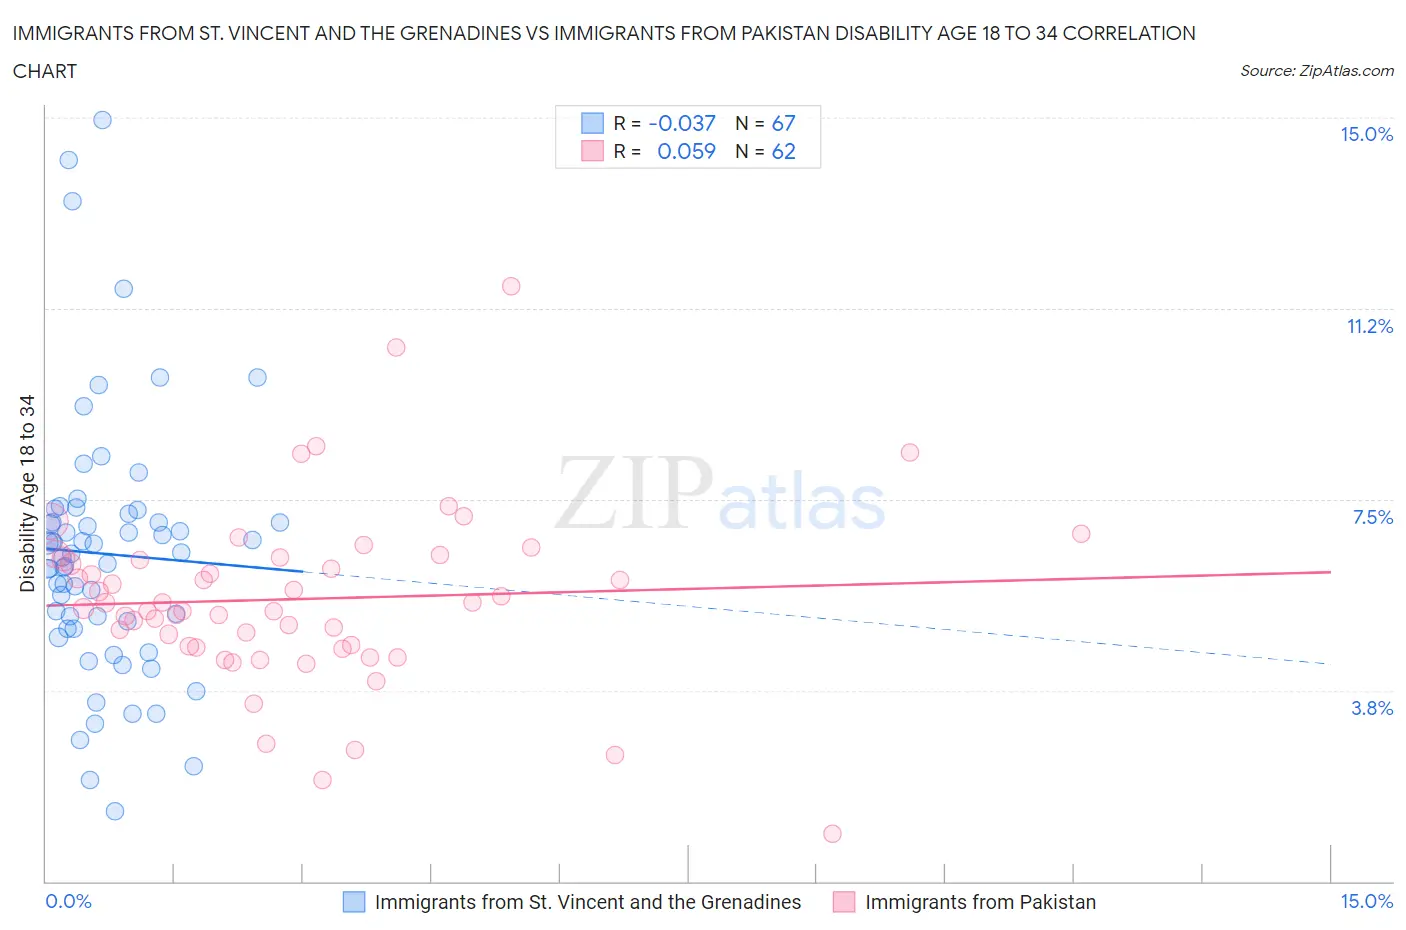
Immigrants from St. Vincent and the Grenadines vs Immigrants from Pakistan Disability Age 18 to 34 Correlation Chart
The statistical analysis conducted on geographies consisting of 56,176,213 people shows no correlation between the proportion of Immigrants from St. Vincent and the Grenadines and percentage of population with a disability between the ages 18 and 35 in the United States with a correlation coefficient (R) of -0.037 and weighted average of 5.5%. Similarly, the statistical analysis conducted on geographies consisting of 283,620,664 people shows a slight positive correlation between the proportion of Immigrants from Pakistan and percentage of population with a disability between the ages 18 and 35 in the United States with a correlation coefficient (R) of 0.059 and weighted average of 5.8%, a difference of 4.1%.
Disability Age 18 to 34 Correlation Summary
| Measurement | Immigrants from St. Vincent and the Grenadines | Immigrants from Pakistan |
| Minimum | 1.4% | 0.93% |
| Maximum | 14.9% | 11.7% |
| Range | 13.6% | 10.7% |
| Mean | 6.4% | 5.5% |
| Median | 6.4% | 5.4% |
| Interquartile 25% (IQ1) | 5.0% | 4.6% |
| Interquartile 75% (IQ3) | 7.2% | 6.3% |
| Interquartile Range (IQR) | 2.2% | 1.7% |
| Standard Deviation (Sample) | 2.6% | 1.8% |
| Standard Deviation (Population) | 2.5% | 1.7% |
Demographics Similar to Immigrants from St. Vincent and the Grenadines and Immigrants from Pakistan by Disability Age 18 to 34
In terms of disability age 18 to 34, the demographic groups most similar to Immigrants from St. Vincent and the Grenadines are Vietnamese (5.5%, a difference of 0.060%), Immigrants from Iran (5.5%, a difference of 0.32%), Indian (Asian) (5.5%, a difference of 0.47%), Immigrants from India (5.6%, a difference of 0.85%), and Immigrants from Israel (5.6%, a difference of 0.88%). Similarly, the demographic groups most similar to Immigrants from Pakistan are Immigrants from Ecuador (5.7%, a difference of 0.20%), Soviet Union (5.7%, a difference of 0.29%), Iranian (5.8%, a difference of 0.32%), Immigrants from Venezuela (5.7%, a difference of 0.38%), and Immigrants from Colombia (5.7%, a difference of 0.49%).
| Demographics | Rating | Rank | Disability Age 18 to 34 |
| Vietnamese | 100.0 /100 | #11 | Exceptional 5.5% |
| Immigrants | St. Vincent and the Grenadines | 100.0 /100 | #12 | Exceptional 5.5% |
| Immigrants | Iran | 100.0 /100 | #13 | Exceptional 5.5% |
| Indians (Asian) | 100.0 /100 | #14 | Exceptional 5.5% |
| Immigrants | India | 100.0 /100 | #15 | Exceptional 5.6% |
| Immigrants | Israel | 100.0 /100 | #16 | Exceptional 5.6% |
| Immigrants | Eastern Asia | 100.0 /100 | #17 | Exceptional 5.6% |
| Immigrants | Bolivia | 100.0 /100 | #18 | Exceptional 5.6% |
| Thais | 100.0 /100 | #19 | Exceptional 5.6% |
| Immigrants | Bangladesh | 100.0 /100 | #20 | Exceptional 5.6% |
| Immigrants | South Central Asia | 100.0 /100 | #21 | Exceptional 5.7% |
| Immigrants | Nicaragua | 100.0 /100 | #22 | Exceptional 5.7% |
| Cubans | 100.0 /100 | #23 | Exceptional 5.7% |
| Immigrants | Argentina | 100.0 /100 | #24 | Exceptional 5.7% |
| Immigrants | Singapore | 100.0 /100 | #25 | Exceptional 5.7% |
| Immigrants | Colombia | 100.0 /100 | #26 | Exceptional 5.7% |
| Immigrants | Venezuela | 99.9 /100 | #27 | Exceptional 5.7% |
| Soviet Union | 99.9 /100 | #28 | Exceptional 5.7% |
| Immigrants | Ecuador | 99.9 /100 | #29 | Exceptional 5.7% |
| Immigrants | Pakistan | 99.9 /100 | #30 | Exceptional 5.8% |
| Iranians | 99.9 /100 | #31 | Exceptional 5.8% |