Immigrants from Southern Europe vs South American Indian Disability Age 18 to 34
COMPARE
Immigrants from Southern Europe
South American Indian
Disability Age 18 to 34
Disability Age 18 to 34 Comparison
Immigrants from Southern Europe
South American Indians
6.5%
DISABILITY AGE 18 TO 34
72.5/ 100
METRIC RATING
160th/ 347
METRIC RANK
6.4%
DISABILITY AGE 18 TO 34
86.5/ 100
METRIC RATING
142nd/ 347
METRIC RANK
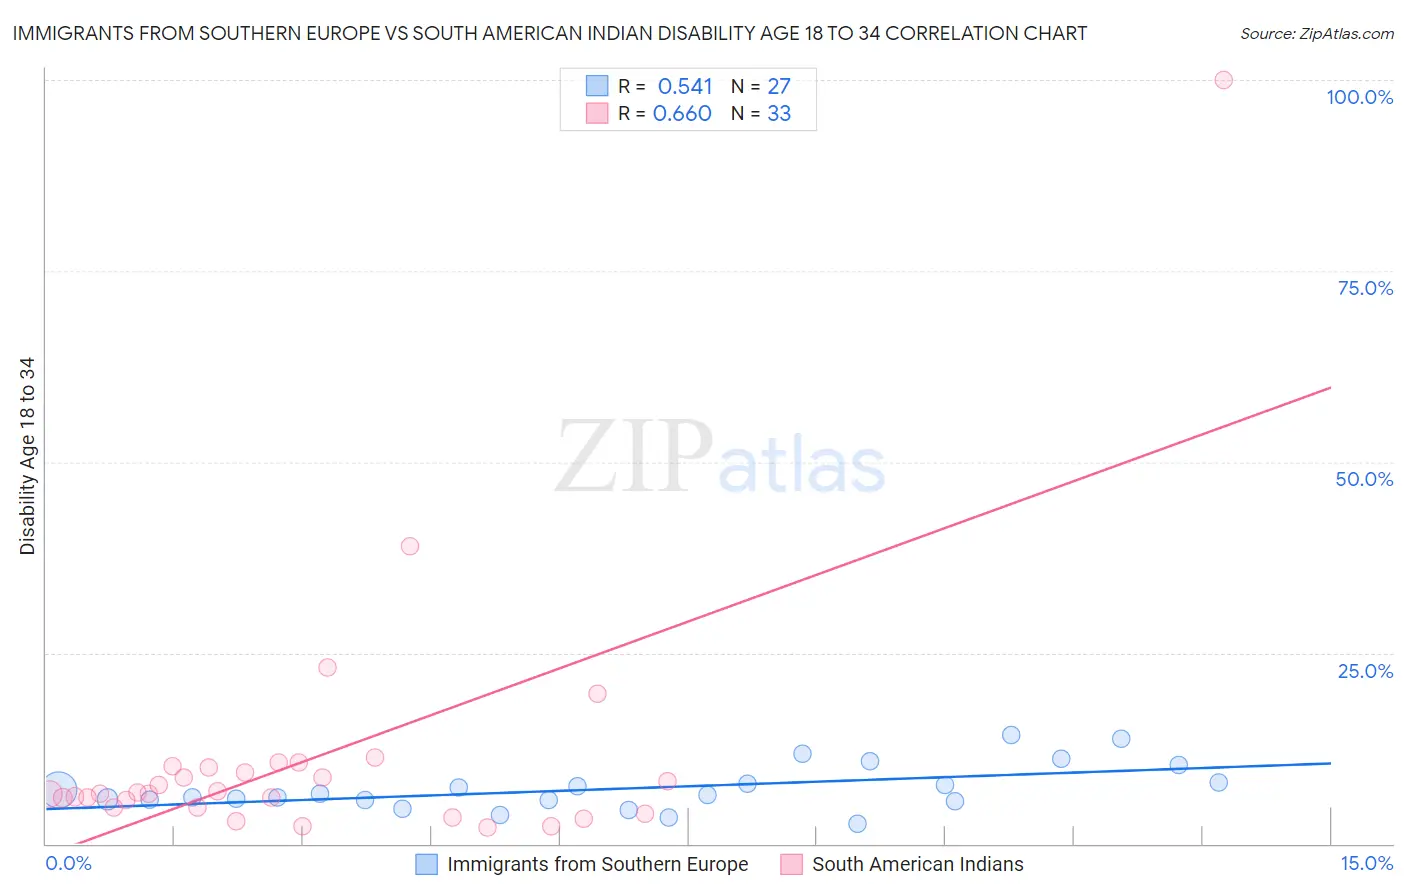
Immigrants from Southern Europe vs South American Indian Disability Age 18 to 34 Correlation Chart
The statistical analysis conducted on geographies consisting of 401,618,598 people shows a substantial positive correlation between the proportion of Immigrants from Southern Europe and percentage of population with a disability between the ages 18 and 35 in the United States with a correlation coefficient (R) of 0.541 and weighted average of 6.5%. Similarly, the statistical analysis conducted on geographies consisting of 164,481,999 people shows a significant positive correlation between the proportion of South American Indians and percentage of population with a disability between the ages 18 and 35 in the United States with a correlation coefficient (R) of 0.660 and weighted average of 6.4%, a difference of 1.6%.
Disability Age 18 to 34 Correlation Summary
| Measurement | Immigrants from Southern Europe | South American Indian |
| Minimum | 2.6% | 2.2% |
| Maximum | 14.2% | 100.0% |
| Range | 11.6% | 97.8% |
| Mean | 7.3% | 11.2% |
| Median | 6.4% | 6.5% |
| Interquartile 25% (IQ1) | 5.7% | 4.8% |
| Interquartile 75% (IQ3) | 8.1% | 10.0% |
| Interquartile Range (IQR) | 2.4% | 5.2% |
| Standard Deviation (Sample) | 3.0% | 17.4% |
| Standard Deviation (Population) | 2.9% | 17.2% |
Demographics Similar to Immigrants from Southern Europe and South American Indians by Disability Age 18 to 34
In terms of disability age 18 to 34, the demographic groups most similar to Immigrants from Southern Europe are Arab (6.5%, a difference of 0.020%), Dominican (6.5%, a difference of 0.090%), Zimbabwean (6.5%, a difference of 0.20%), Immigrants from Sierra Leone (6.5%, a difference of 0.23%), and Immigrants from Panama (6.5%, a difference of 0.26%). Similarly, the demographic groups most similar to South American Indians are Immigrants from Latvia (6.4%, a difference of 0.020%), Jamaican (6.4%, a difference of 0.030%), Albanian (6.4%, a difference of 0.19%), Moroccan (6.4%, a difference of 0.19%), and Belizean (6.4%, a difference of 0.25%).
| Demographics | Rating | Rank | Disability Age 18 to 34 |
| Jamaicans | 86.8 /100 | #141 | Excellent 6.4% |
| South American Indians | 86.5 /100 | #142 | Excellent 6.4% |
| Immigrants | Latvia | 86.4 /100 | #143 | Excellent 6.4% |
| Albanians | 85.3 /100 | #144 | Excellent 6.4% |
| Moroccans | 85.2 /100 | #145 | Excellent 6.4% |
| Belizeans | 84.9 /100 | #146 | Excellent 6.4% |
| Immigrants | South Africa | 83.7 /100 | #147 | Excellent 6.4% |
| Immigrants | Belgium | 83.5 /100 | #148 | Excellent 6.4% |
| Hondurans | 83.1 /100 | #149 | Excellent 6.4% |
| Immigrants | Dominican Republic | 82.7 /100 | #150 | Excellent 6.4% |
| Tongans | 81.9 /100 | #151 | Excellent 6.4% |
| Bulgarians | 78.3 /100 | #152 | Good 6.5% |
| Immigrants | Eritrea | 77.4 /100 | #153 | Good 6.5% |
| Immigrants | Central America | 76.8 /100 | #154 | Good 6.5% |
| Inupiat | 76.7 /100 | #155 | Good 6.5% |
| Immigrants | Panama | 75.3 /100 | #156 | Good 6.5% |
| Immigrants | Sierra Leone | 75.0 /100 | #157 | Good 6.5% |
| Zimbabweans | 74.7 /100 | #158 | Good 6.5% |
| Dominicans | 73.6 /100 | #159 | Good 6.5% |
| Immigrants | Southern Europe | 72.5 /100 | #160 | Good 6.5% |
| Arabs | 72.3 /100 | #161 | Good 6.5% |