Immigrants from Southern Europe vs Immigrants from Belgium Disability
COMPARE
Immigrants from Southern Europe
Immigrants from Belgium
Disability
Disability Comparison
Immigrants from Southern Europe
Immigrants from Belgium
11.7%
DISABILITY
52.8/ 100
METRIC RATING
171st/ 347
METRIC RANK
11.0%
DISABILITY
99.3/ 100
METRIC RATING
77th/ 347
METRIC RANK
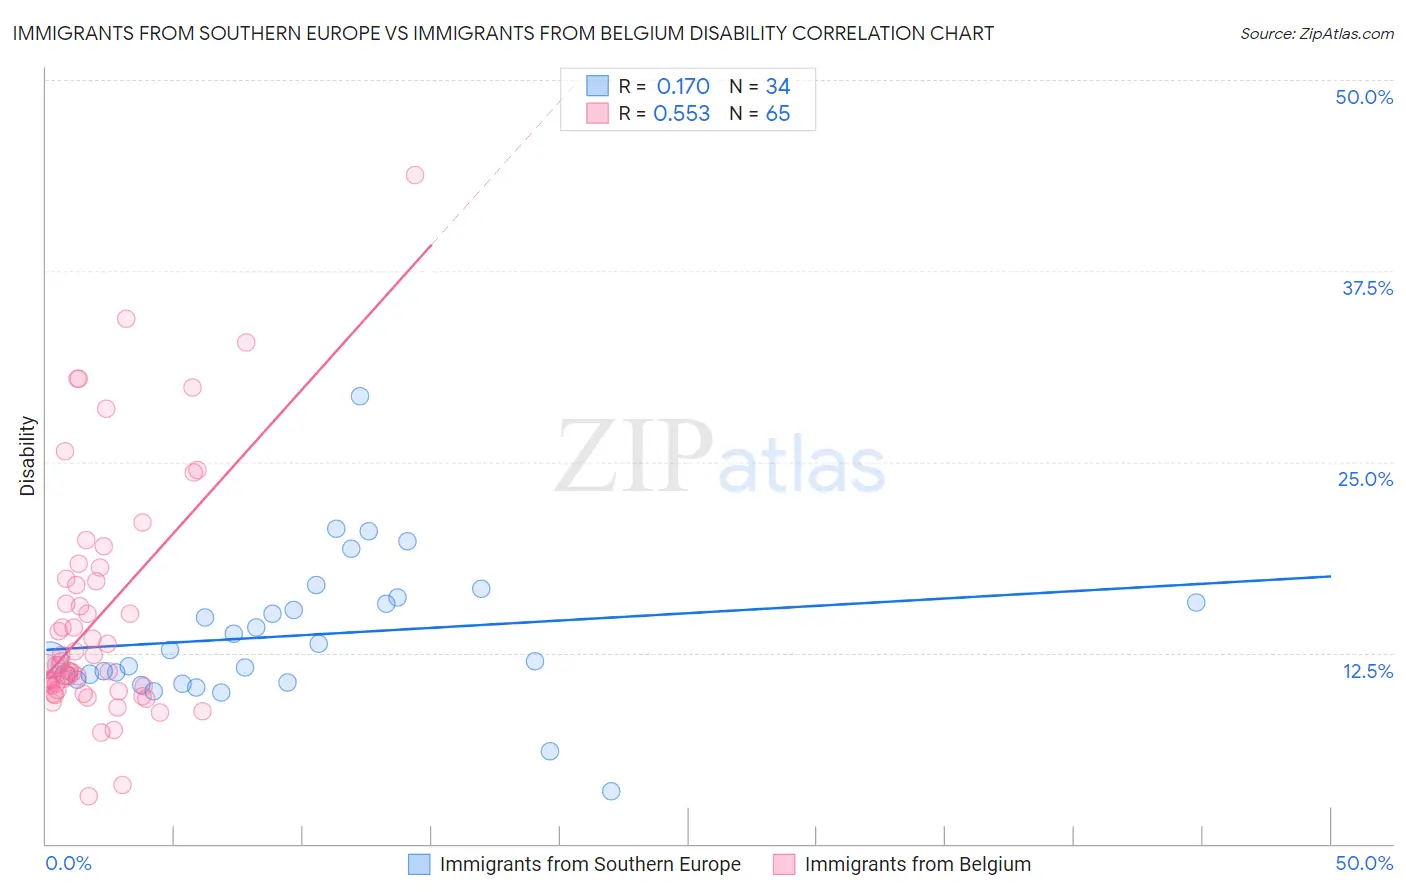
Immigrants from Southern Europe vs Immigrants from Belgium Disability Correlation Chart
The statistical analysis conducted on geographies consisting of 402,790,716 people shows a poor positive correlation between the proportion of Immigrants from Southern Europe and percentage of population with a disability in the United States with a correlation coefficient (R) of 0.170 and weighted average of 11.7%. Similarly, the statistical analysis conducted on geographies consisting of 146,717,814 people shows a substantial positive correlation between the proportion of Immigrants from Belgium and percentage of population with a disability in the United States with a correlation coefficient (R) of 0.553 and weighted average of 11.0%, a difference of 5.8%.
Disability Correlation Summary
| Measurement | Immigrants from Southern Europe | Immigrants from Belgium |
| Minimum | 3.4% | 3.1% |
| Maximum | 29.3% | 43.8% |
| Range | 25.9% | 40.7% |
| Mean | 13.6% | 14.9% |
| Median | 12.3% | 11.7% |
| Interquartile 25% (IQ1) | 10.7% | 10.2% |
| Interquartile 75% (IQ3) | 15.8% | 17.3% |
| Interquartile Range (IQR) | 5.0% | 7.1% |
| Standard Deviation (Sample) | 4.7% | 7.8% |
| Standard Deviation (Population) | 4.6% | 7.7% |
Similar Demographics by Disability
Demographics Similar to Immigrants from Southern Europe by Disability
In terms of disability, the demographic groups most similar to Immigrants from Southern Europe are Immigrants from Albania (11.7%, a difference of 0.0%), Trinidadian and Tobagonian (11.7%, a difference of 0.010%), Immigrants from Austria (11.7%, a difference of 0.030%), Immigrants from Latin America (11.7%, a difference of 0.060%), and Estonian (11.7%, a difference of 0.070%).
| Demographics | Rating | Rank | Disability |
| Syrians | 58.5 /100 | #164 | Average 11.7% |
| Cubans | 56.7 /100 | #165 | Average 11.7% |
| Pakistanis | 54.7 /100 | #166 | Average 11.7% |
| Estonians | 54.4 /100 | #167 | Average 11.7% |
| Immigrants | Latin America | 54.1 /100 | #168 | Average 11.7% |
| Immigrants | Austria | 53.4 /100 | #169 | Average 11.7% |
| Immigrants | Albania | 52.8 /100 | #170 | Average 11.7% |
| Immigrants | Southern Europe | 52.8 /100 | #171 | Average 11.7% |
| Trinidadians and Tobagonians | 52.7 /100 | #172 | Average 11.7% |
| Maltese | 50.6 /100 | #173 | Average 11.7% |
| Albanians | 50.0 /100 | #174 | Average 11.7% |
| Haitians | 48.6 /100 | #175 | Average 11.7% |
| Immigrants | Western Africa | 47.5 /100 | #176 | Average 11.7% |
| Immigrants | Central America | 46.6 /100 | #177 | Average 11.7% |
| Greeks | 46.2 /100 | #178 | Average 11.7% |
Demographics Similar to Immigrants from Belgium by Disability
In terms of disability, the demographic groups most similar to Immigrants from Belgium are Sierra Leonean (11.0%, a difference of 0.0%), Immigrants from Vietnam (11.0%, a difference of 0.030%), Immigrants from Cameroon (11.1%, a difference of 0.040%), Immigrants from Serbia (11.0%, a difference of 0.050%), and Immigrants from Bangladesh (11.0%, a difference of 0.070%).
| Demographics | Rating | Rank | Disability |
| Immigrants | France | 99.4 /100 | #70 | Exceptional 11.0% |
| Immigrants | Lebanon | 99.4 /100 | #71 | Exceptional 11.0% |
| Immigrants | Chile | 99.4 /100 | #72 | Exceptional 11.0% |
| Immigrants | Bangladesh | 99.4 /100 | #73 | Exceptional 11.0% |
| Immigrants | Serbia | 99.4 /100 | #74 | Exceptional 11.0% |
| Immigrants | Vietnam | 99.4 /100 | #75 | Exceptional 11.0% |
| Sierra Leoneans | 99.3 /100 | #76 | Exceptional 11.0% |
| Immigrants | Belgium | 99.3 /100 | #77 | Exceptional 11.0% |
| Immigrants | Cameroon | 99.3 /100 | #78 | Exceptional 11.1% |
| Immigrants | Jordan | 99.3 /100 | #79 | Exceptional 11.1% |
| Immigrants | Ireland | 99.3 /100 | #80 | Exceptional 11.1% |
| Immigrants | Poland | 99.1 /100 | #81 | Exceptional 11.1% |
| Chileans | 99.1 /100 | #82 | Exceptional 11.1% |
| Immigrants | Switzerland | 99.0 /100 | #83 | Exceptional 11.1% |
| Immigrants | Sierra Leone | 99.0 /100 | #84 | Exceptional 11.1% |