Immigrants from Southern Europe vs Creek Disability Age 35 to 64
COMPARE
Immigrants from Southern Europe
Creek
Disability Age 35 to 64
Disability Age 35 to 64 Comparison
Immigrants from Southern Europe
Creek
10.7%
DISABILITY AGE 35 TO 64
91.5/ 100
METRIC RATING
138th/ 347
METRIC RANK
16.9%
DISABILITY AGE 35 TO 64
0.0/ 100
METRIC RATING
343rd/ 347
METRIC RANK
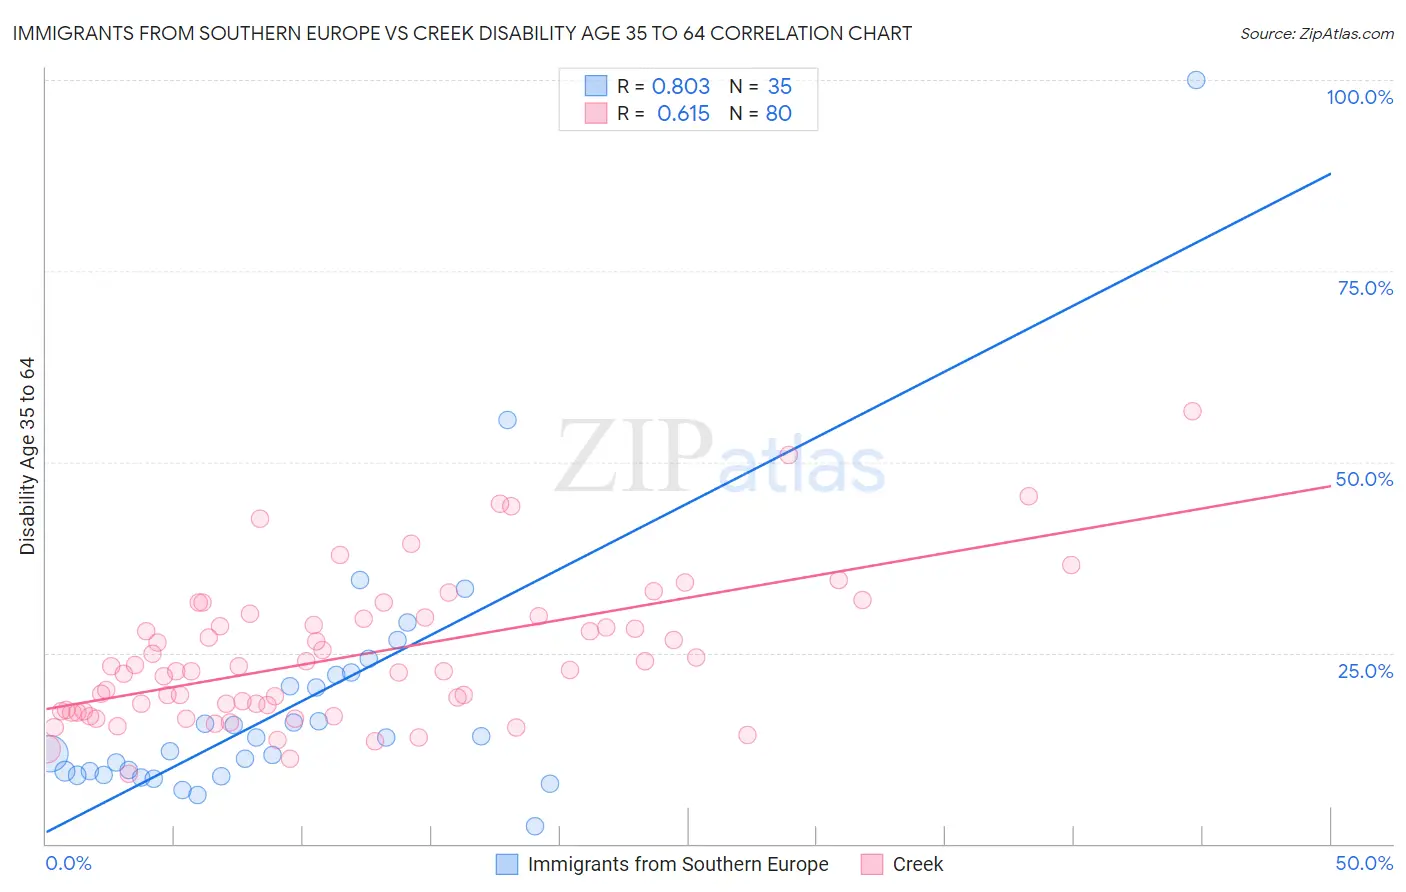
Immigrants from Southern Europe vs Creek Disability Age 35 to 64 Correlation Chart
The statistical analysis conducted on geographies consisting of 402,559,548 people shows a very strong positive correlation between the proportion of Immigrants from Southern Europe and percentage of population with a disability between the ages 34 and 64 in the United States with a correlation coefficient (R) of 0.803 and weighted average of 10.7%. Similarly, the statistical analysis conducted on geographies consisting of 178,427,541 people shows a significant positive correlation between the proportion of Creek and percentage of population with a disability between the ages 34 and 64 in the United States with a correlation coefficient (R) of 0.615 and weighted average of 16.9%, a difference of 57.3%.
Disability Age 35 to 64 Correlation Summary
| Measurement | Immigrants from Southern Europe | Creek |
| Minimum | 2.2% | 9.2% |
| Maximum | 100.0% | 56.7% |
| Range | 97.8% | 47.4% |
| Mean | 18.5% | 24.6% |
| Median | 13.8% | 22.7% |
| Interquartile 25% (IQ1) | 9.0% | 17.4% |
| Interquartile 75% (IQ3) | 22.2% | 29.5% |
| Interquartile Range (IQR) | 13.2% | 12.1% |
| Standard Deviation (Sample) | 17.5% | 9.4% |
| Standard Deviation (Population) | 17.3% | 9.3% |
Similar Demographics by Disability Age 35 to 64
Demographics Similar to Immigrants from Southern Europe by Disability Age 35 to 64
In terms of disability age 35 to 64, the demographic groups most similar to Immigrants from Southern Europe are Costa Rican (10.7%, a difference of 0.010%), Immigrants from Costa Rica (10.7%, a difference of 0.050%), Immigrants from Scotland (10.7%, a difference of 0.060%), Salvadoran (10.7%, a difference of 0.12%), and Australian (10.8%, a difference of 0.19%).
| Demographics | Rating | Rank | Disability Age 35 to 64 |
| Immigrants | El Salvador | 92.8 /100 | #131 | Exceptional 10.7% |
| Immigrants | Albania | 92.5 /100 | #132 | Exceptional 10.7% |
| Immigrants | Immigrants | 92.5 /100 | #133 | Exceptional 10.7% |
| Immigrants | Ecuador | 92.5 /100 | #134 | Exceptional 10.7% |
| Greeks | 92.3 /100 | #135 | Exceptional 10.7% |
| Salvadorans | 91.9 /100 | #136 | Exceptional 10.7% |
| Immigrants | Costa Rica | 91.7 /100 | #137 | Exceptional 10.7% |
| Immigrants | Southern Europe | 91.5 /100 | #138 | Exceptional 10.7% |
| Costa Ricans | 91.4 /100 | #139 | Exceptional 10.7% |
| Immigrants | Scotland | 91.3 /100 | #140 | Exceptional 10.7% |
| Australians | 90.7 /100 | #141 | Exceptional 10.8% |
| Immigrants | Saudi Arabia | 90.6 /100 | #142 | Exceptional 10.8% |
| Sierra Leoneans | 89.7 /100 | #143 | Excellent 10.8% |
| Lithuanians | 88.7 /100 | #144 | Excellent 10.8% |
| Immigrants | Bangladesh | 85.6 /100 | #145 | Excellent 10.9% |
Demographics Similar to Creek by Disability Age 35 to 64
In terms of disability age 35 to 64, the demographic groups most similar to Creek are Yup'ik (16.9%, a difference of 0.32%), Tohono O'odham (16.7%, a difference of 0.86%), Tsimshian (16.7%, a difference of 0.97%), Kiowa (17.4%, a difference of 2.8%), and Choctaw (16.4%, a difference of 2.9%).
| Demographics | Rating | Rank | Disability Age 35 to 64 |
| Yuman | 0.0 /100 | #333 | Tragic 15.8% |
| Colville | 0.0 /100 | #334 | Tragic 15.8% |
| Seminole | 0.0 /100 | #335 | Tragic 15.9% |
| Menominee | 0.0 /100 | #336 | Tragic 15.9% |
| Puerto Ricans | 0.0 /100 | #337 | Tragic 15.9% |
| Chickasaw | 0.0 /100 | #338 | Tragic 16.1% |
| Pima | 0.0 /100 | #339 | Tragic 16.1% |
| Choctaw | 0.0 /100 | #340 | Tragic 16.4% |
| Tsimshian | 0.0 /100 | #341 | Tragic 16.7% |
| Tohono O'odham | 0.0 /100 | #342 | Tragic 16.7% |
| Creek | 0.0 /100 | #343 | Tragic 16.9% |
| Yup'ik | 0.0 /100 | #344 | Tragic 16.9% |
| Kiowa | 0.0 /100 | #345 | Tragic 17.4% |
| Lumbee | 0.0 /100 | #346 | Tragic 17.6% |
| Houma | 0.0 /100 | #347 | Tragic 18.7% |