Immigrants from South Central Asia vs Sri Lankan Vision Disability
COMPARE
Immigrants from South Central Asia
Sri Lankan
Vision Disability
Vision Disability Comparison
Immigrants from South Central Asia
Sri Lankans
1.8%
VISION DISABILITY
100.0/ 100
METRIC RATING
7th/ 347
METRIC RANK
2.1%
VISION DISABILITY
94.8/ 100
METRIC RATING
102nd/ 347
METRIC RANK
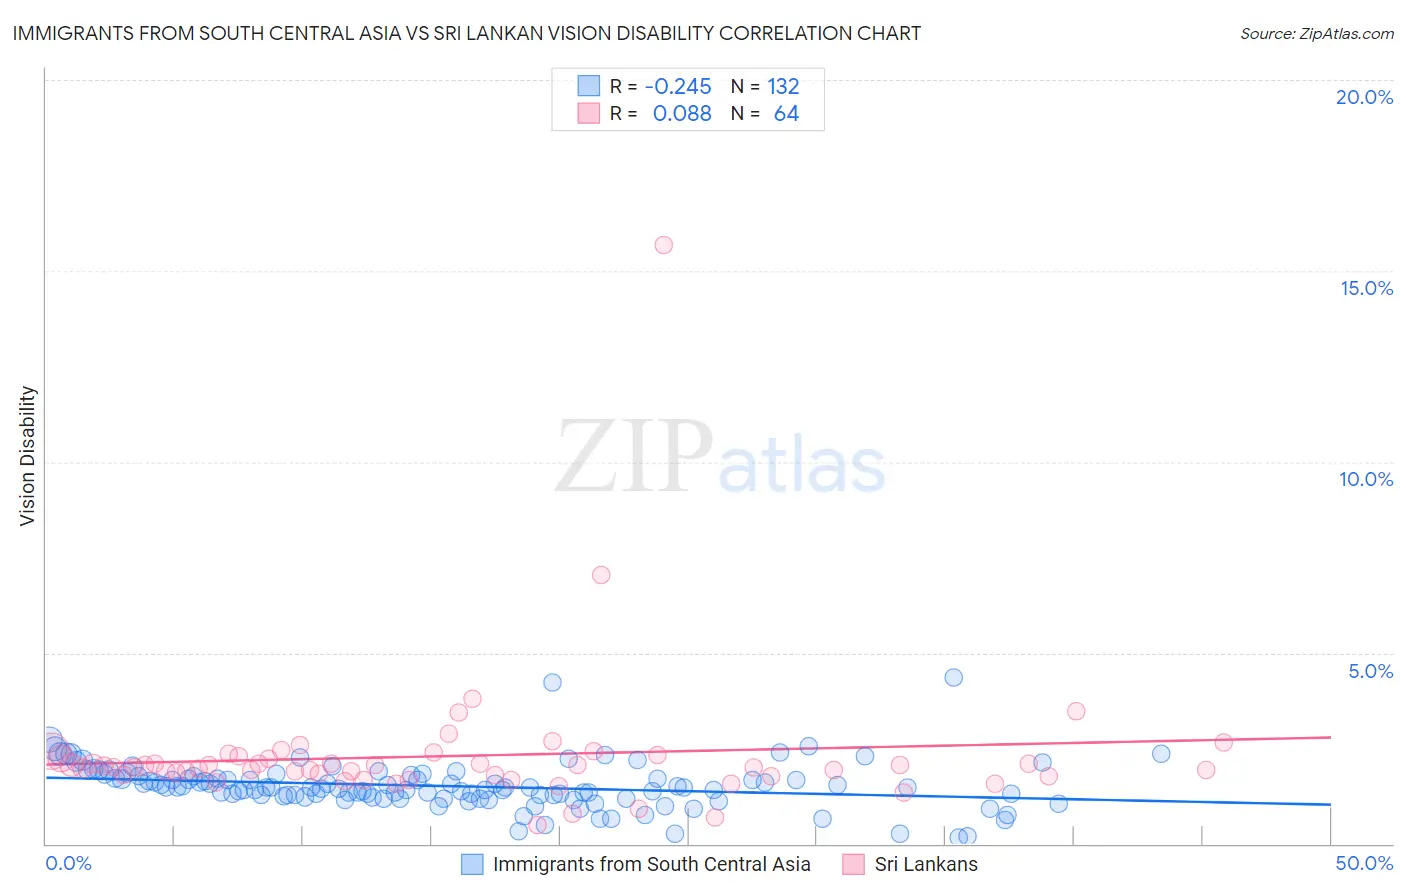
Immigrants from South Central Asia vs Sri Lankan Vision Disability Correlation Chart
The statistical analysis conducted on geographies consisting of 472,559,248 people shows a weak negative correlation between the proportion of Immigrants from South Central Asia and percentage of population with vision disability in the United States with a correlation coefficient (R) of -0.245 and weighted average of 1.8%. Similarly, the statistical analysis conducted on geographies consisting of 440,158,739 people shows a slight positive correlation between the proportion of Sri Lankans and percentage of population with vision disability in the United States with a correlation coefficient (R) of 0.088 and weighted average of 2.1%, a difference of 15.8%.
Vision Disability Correlation Summary
| Measurement | Immigrants from South Central Asia | Sri Lankan |
| Minimum | 0.18% | 0.49% |
| Maximum | 4.4% | 15.7% |
| Range | 4.2% | 15.2% |
| Mean | 1.5% | 2.3% |
| Median | 1.5% | 2.0% |
| Interquartile 25% (IQ1) | 1.2% | 1.8% |
| Interquartile 75% (IQ3) | 1.7% | 2.3% |
| Interquartile Range (IQR) | 0.50% | 0.48% |
| Standard Deviation (Sample) | 0.60% | 1.9% |
| Standard Deviation (Population) | 0.60% | 1.9% |
Similar Demographics by Vision Disability
Demographics Similar to Immigrants from South Central Asia by Vision Disability
In terms of vision disability, the demographic groups most similar to Immigrants from South Central Asia are Immigrants from Iran (1.8%, a difference of 0.060%), Iranian (1.8%, a difference of 0.15%), Okinawan (1.8%, a difference of 0.65%), Immigrants from Singapore (1.8%, a difference of 0.89%), and Immigrants from Hong Kong (1.8%, a difference of 1.1%).
| Demographics | Rating | Rank | Vision Disability |
| Immigrants | India | 100.0 /100 | #1 | Exceptional 1.7% |
| Filipinos | 100.0 /100 | #2 | Exceptional 1.7% |
| Immigrants | Taiwan | 100.0 /100 | #3 | Exceptional 1.7% |
| Thais | 100.0 /100 | #4 | Exceptional 1.7% |
| Okinawans | 100.0 /100 | #5 | Exceptional 1.8% |
| Immigrants | Iran | 100.0 /100 | #6 | Exceptional 1.8% |
| Immigrants | South Central Asia | 100.0 /100 | #7 | Exceptional 1.8% |
| Iranians | 100.0 /100 | #8 | Exceptional 1.8% |
| Immigrants | Singapore | 100.0 /100 | #9 | Exceptional 1.8% |
| Immigrants | Hong Kong | 100.0 /100 | #10 | Exceptional 1.8% |
| Immigrants | Israel | 100.0 /100 | #11 | Exceptional 1.8% |
| Immigrants | Korea | 100.0 /100 | #12 | Exceptional 1.8% |
| Immigrants | Eastern Asia | 100.0 /100 | #13 | Exceptional 1.8% |
| Immigrants | China | 100.0 /100 | #14 | Exceptional 1.8% |
| Immigrants | Bolivia | 100.0 /100 | #15 | Exceptional 1.8% |
Demographics Similar to Sri Lankans by Vision Disability
In terms of vision disability, the demographic groups most similar to Sri Lankans are Albanian (2.1%, a difference of 0.030%), Greek (2.1%, a difference of 0.11%), Immigrants from Austria (2.1%, a difference of 0.14%), Estonian (2.1%, a difference of 0.15%), and Immigrants from Italy (2.1%, a difference of 0.15%).
| Demographics | Rating | Rank | Vision Disability |
| Australians | 95.9 /100 | #95 | Exceptional 2.1% |
| Romanians | 95.7 /100 | #96 | Exceptional 2.1% |
| Immigrants | Afghanistan | 95.6 /100 | #97 | Exceptional 2.1% |
| Immigrants | South Africa | 95.4 /100 | #98 | Exceptional 2.1% |
| Estonians | 95.3 /100 | #99 | Exceptional 2.1% |
| Greeks | 95.1 /100 | #100 | Exceptional 2.1% |
| Albanians | 94.9 /100 | #101 | Exceptional 2.1% |
| Sri Lankans | 94.8 /100 | #102 | Exceptional 2.1% |
| Immigrants | Austria | 94.4 /100 | #103 | Exceptional 2.1% |
| Immigrants | Italy | 94.4 /100 | #104 | Exceptional 2.1% |
| Carpatho Rusyns | 94.3 /100 | #105 | Exceptional 2.1% |
| Swedes | 94.2 /100 | #106 | Exceptional 2.1% |
| Danes | 94.2 /100 | #107 | Exceptional 2.1% |
| Koreans | 94.1 /100 | #108 | Exceptional 2.1% |
| Chileans | 94.0 /100 | #109 | Exceptional 2.1% |