Immigrants from South Central Asia vs Comanche Cognitive Disability
COMPARE
Immigrants from South Central Asia
Comanche
Cognitive Disability
Cognitive Disability Comparison
Immigrants from South Central Asia
Comanche
16.4%
COGNITIVE DISABILITY
99.9/ 100
METRIC RATING
22nd/ 347
METRIC RANK
18.6%
COGNITIVE DISABILITY
0.0/ 100
METRIC RATING
319th/ 347
METRIC RANK
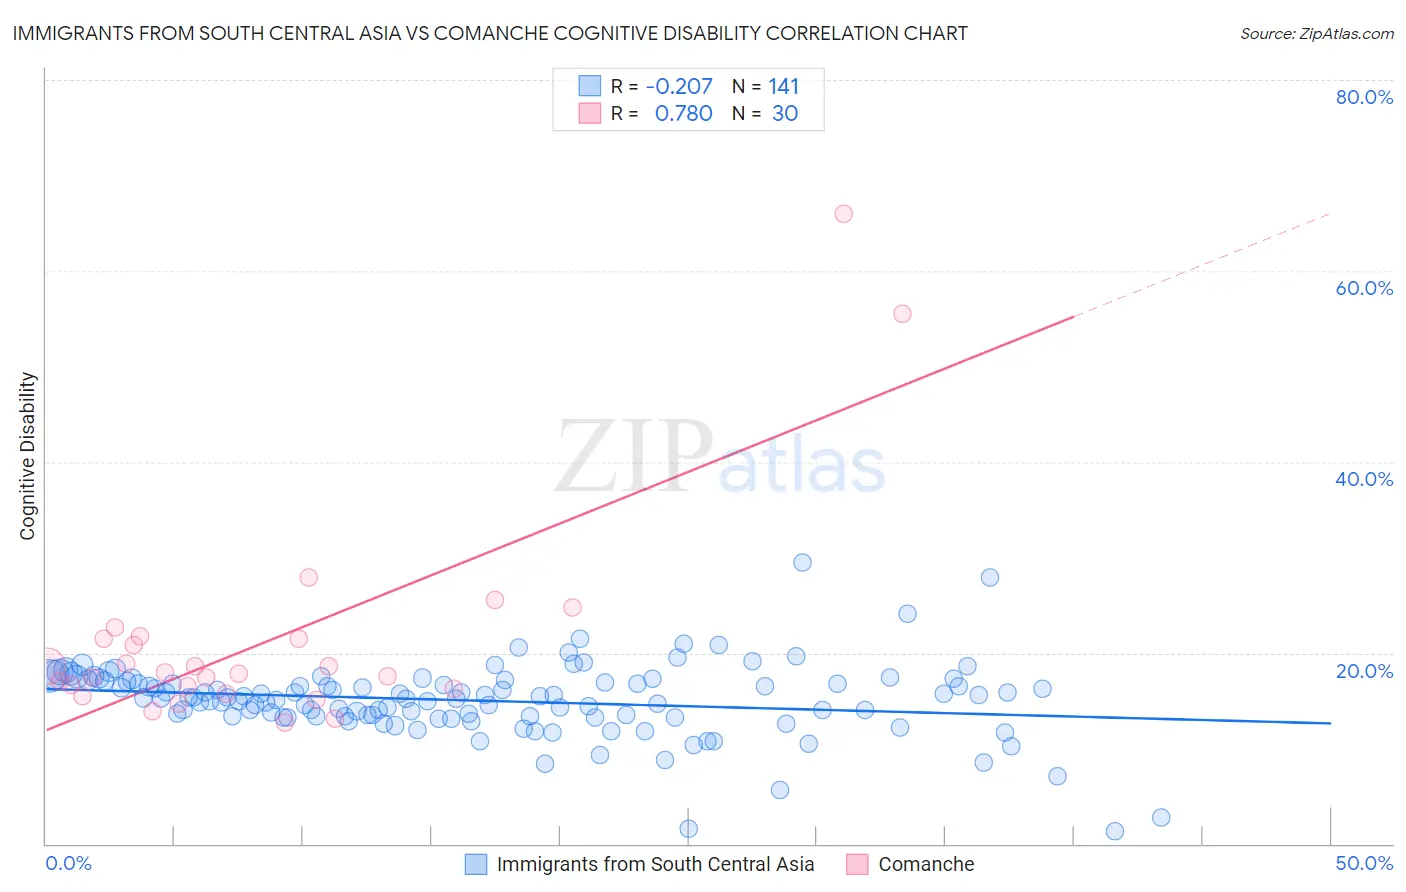
Immigrants from South Central Asia vs Comanche Cognitive Disability Correlation Chart
The statistical analysis conducted on geographies consisting of 473,055,858 people shows a weak negative correlation between the proportion of Immigrants from South Central Asia and percentage of population with cognitive disability in the United States with a correlation coefficient (R) of -0.207 and weighted average of 16.4%. Similarly, the statistical analysis conducted on geographies consisting of 109,776,806 people shows a strong positive correlation between the proportion of Comanche and percentage of population with cognitive disability in the United States with a correlation coefficient (R) of 0.780 and weighted average of 18.6%, a difference of 13.8%.
Cognitive Disability Correlation Summary
| Measurement | Immigrants from South Central Asia | Comanche |
| Minimum | 1.4% | 12.7% |
| Maximum | 29.4% | 66.0% |
| Range | 28.0% | 53.3% |
| Mean | 15.0% | 21.3% |
| Median | 15.3% | 17.9% |
| Interquartile 25% (IQ1) | 13.3% | 16.2% |
| Interquartile 75% (IQ3) | 17.0% | 21.5% |
| Interquartile Range (IQR) | 3.7% | 5.3% |
| Standard Deviation (Sample) | 3.8% | 11.4% |
| Standard Deviation (Population) | 3.8% | 11.2% |
Similar Demographics by Cognitive Disability
Demographics Similar to Immigrants from South Central Asia by Cognitive Disability
In terms of cognitive disability, the demographic groups most similar to Immigrants from South Central Asia are Croatian (16.4%, a difference of 0.030%), Immigrants from Argentina (16.4%, a difference of 0.060%), Luxembourger (16.4%, a difference of 0.10%), Immigrants from Cuba (16.3%, a difference of 0.13%), and Immigrants from Croatia (16.4%, a difference of 0.13%).
| Demographics | Rating | Rank | Cognitive Disability |
| Immigrants | Greece | 100.0 /100 | #15 | Exceptional 16.3% |
| Eastern Europeans | 100.0 /100 | #16 | Exceptional 16.3% |
| Immigrants | North Macedonia | 100.0 /100 | #17 | Exceptional 16.3% |
| Immigrants | Northern Europe | 100.0 /100 | #18 | Exceptional 16.3% |
| Immigrants | Bolivia | 100.0 /100 | #19 | Exceptional 16.3% |
| Bulgarians | 100.0 /100 | #20 | Exceptional 16.3% |
| Immigrants | Cuba | 100.0 /100 | #21 | Exceptional 16.3% |
| Immigrants | South Central Asia | 99.9 /100 | #22 | Exceptional 16.4% |
| Croatians | 99.9 /100 | #23 | Exceptional 16.4% |
| Immigrants | Argentina | 99.9 /100 | #24 | Exceptional 16.4% |
| Luxembourgers | 99.9 /100 | #25 | Exceptional 16.4% |
| Immigrants | Croatia | 99.9 /100 | #26 | Exceptional 16.4% |
| Immigrants | Pakistan | 99.9 /100 | #27 | Exceptional 16.4% |
| Poles | 99.9 /100 | #28 | Exceptional 16.4% |
| Filipinos | 99.9 /100 | #29 | Exceptional 16.4% |
Demographics Similar to Comanche by Cognitive Disability
In terms of cognitive disability, the demographic groups most similar to Comanche are Bangladeshi (18.6%, a difference of 0.040%), Apache (18.6%, a difference of 0.040%), African (18.6%, a difference of 0.13%), Liberian (18.6%, a difference of 0.16%), and Immigrants from Liberia (18.7%, a difference of 0.19%).
| Demographics | Rating | Rank | Cognitive Disability |
| Chickasaw | 0.0 /100 | #312 | Tragic 18.5% |
| Yaqui | 0.0 /100 | #313 | Tragic 18.5% |
| Sub-Saharan Africans | 0.0 /100 | #314 | Tragic 18.5% |
| Immigrants | Dominica | 0.0 /100 | #315 | Tragic 18.6% |
| Immigrants | Middle Africa | 0.0 /100 | #316 | Tragic 18.6% |
| Liberians | 0.0 /100 | #317 | Tragic 18.6% |
| Bangladeshis | 0.0 /100 | #318 | Tragic 18.6% |
| Comanche | 0.0 /100 | #319 | Tragic 18.6% |
| Apache | 0.0 /100 | #320 | Tragic 18.6% |
| Africans | 0.0 /100 | #321 | Tragic 18.6% |
| Immigrants | Liberia | 0.0 /100 | #322 | Tragic 18.7% |
| Pueblo | 0.0 /100 | #323 | Tragic 18.7% |
| Dominicans | 0.0 /100 | #324 | Tragic 18.7% |
| Indonesians | 0.0 /100 | #325 | Tragic 18.7% |
| Immigrants | Senegal | 0.0 /100 | #326 | Tragic 18.7% |