Immigrants from South America vs Northern European Disability
COMPARE
Immigrants from South America
Northern European
Disability
Disability Comparison
Immigrants from South America
Northern Europeans
10.9%
DISABILITY
99.8/ 100
METRIC RATING
58th/ 347
METRIC RANK
12.1%
DISABILITY
4.2/ 100
METRIC RATING
221st/ 347
METRIC RANK
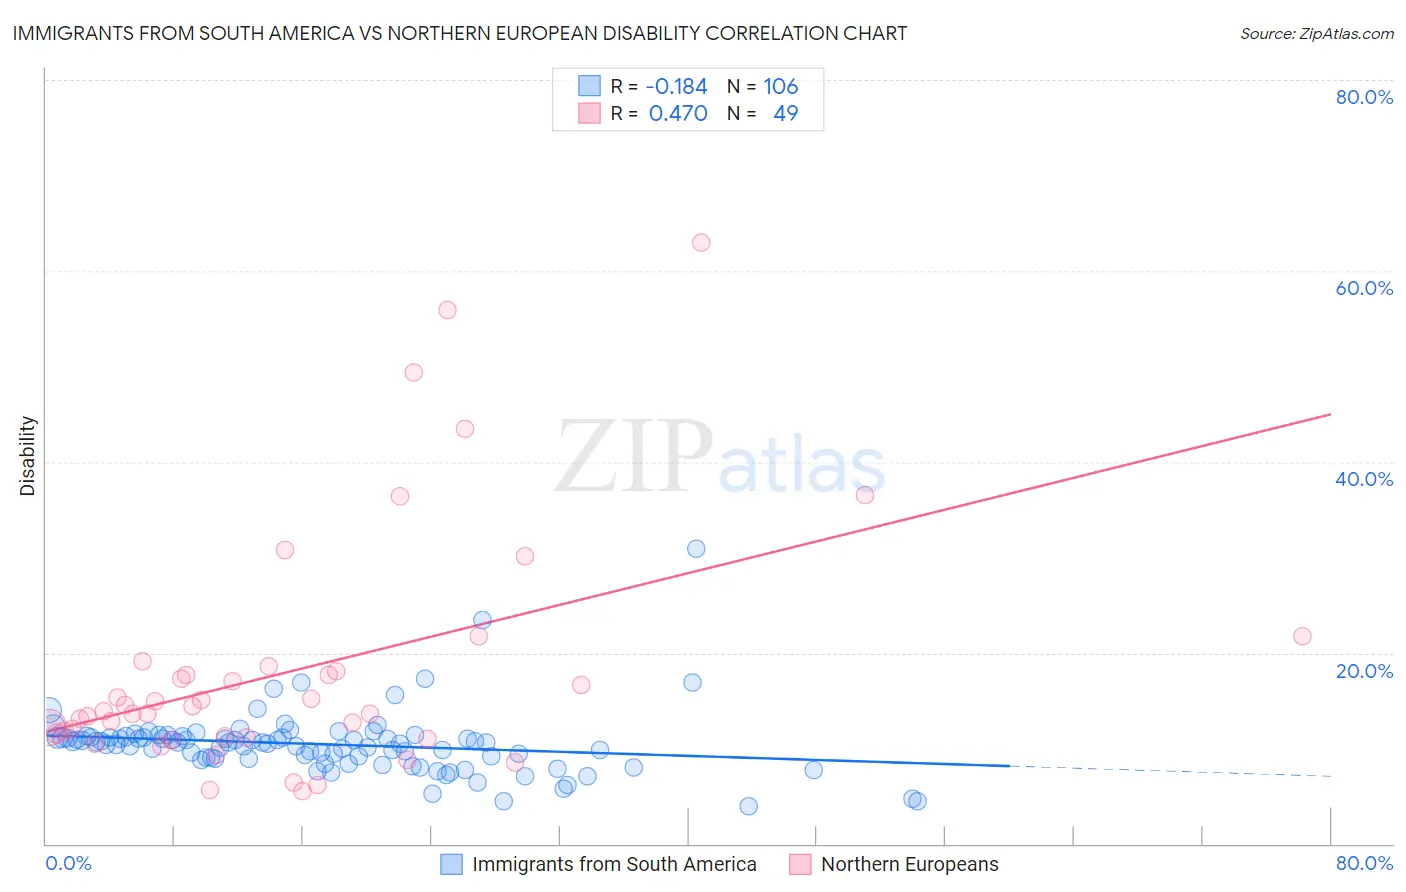
Immigrants from South America vs Northern European Disability Correlation Chart
The statistical analysis conducted on geographies consisting of 486,347,042 people shows a poor negative correlation between the proportion of Immigrants from South America and percentage of population with a disability in the United States with a correlation coefficient (R) of -0.184 and weighted average of 10.9%. Similarly, the statistical analysis conducted on geographies consisting of 406,050,412 people shows a moderate positive correlation between the proportion of Northern Europeans and percentage of population with a disability in the United States with a correlation coefficient (R) of 0.470 and weighted average of 12.1%, a difference of 10.9%.
Disability Correlation Summary
| Measurement | Immigrants from South America | Northern European |
| Minimum | 3.9% | 5.4% |
| Maximum | 31.0% | 63.0% |
| Range | 27.0% | 57.5% |
| Mean | 10.4% | 18.2% |
| Median | 10.6% | 13.8% |
| Interquartile 25% (IQ1) | 9.0% | 11.2% |
| Interquartile 75% (IQ3) | 11.2% | 18.3% |
| Interquartile Range (IQR) | 2.2% | 7.1% |
| Standard Deviation (Sample) | 3.4% | 12.6% |
| Standard Deviation (Population) | 3.4% | 12.5% |
Similar Demographics by Disability
Demographics Similar to Immigrants from South America by Disability
In terms of disability, the demographic groups most similar to Immigrants from South America are Salvadoran (10.9%, a difference of 0.030%), Immigrants from Colombia (10.9%, a difference of 0.090%), Zimbabwean (10.9%, a difference of 0.18%), Immigrants from Bulgaria (10.9%, a difference of 0.24%), and Immigrants from Lithuania (10.9%, a difference of 0.27%).
| Demographics | Rating | Rank | Disability |
| Peruvians | 99.8 /100 | #51 | Exceptional 10.9% |
| South Americans | 99.8 /100 | #52 | Exceptional 10.9% |
| Immigrants | Spain | 99.8 /100 | #53 | Exceptional 10.9% |
| Jordanians | 99.8 /100 | #54 | Exceptional 10.9% |
| Immigrants | El Salvador | 99.8 /100 | #55 | Exceptional 10.9% |
| Immigrants | Lithuania | 99.8 /100 | #56 | Exceptional 10.9% |
| Salvadorans | 99.8 /100 | #57 | Exceptional 10.9% |
| Immigrants | South America | 99.8 /100 | #58 | Exceptional 10.9% |
| Immigrants | Colombia | 99.7 /100 | #59 | Exceptional 10.9% |
| Zimbabweans | 99.7 /100 | #60 | Exceptional 10.9% |
| Immigrants | Bulgaria | 99.7 /100 | #61 | Exceptional 10.9% |
| Immigrants | Northern Africa | 99.7 /100 | #62 | Exceptional 10.9% |
| Immigrants | Eritrea | 99.7 /100 | #63 | Exceptional 11.0% |
| Immigrants | Sweden | 99.6 /100 | #64 | Exceptional 11.0% |
| Bulgarians | 99.6 /100 | #65 | Exceptional 11.0% |
Demographics Similar to Northern Europeans by Disability
In terms of disability, the demographic groups most similar to Northern Europeans are Spanish American Indian (12.1%, a difference of 0.040%), Hispanic or Latino (12.1%, a difference of 0.070%), Immigrants from Bahamas (12.1%, a difference of 0.12%), Mexican (12.1%, a difference of 0.14%), and Croatian (12.1%, a difference of 0.16%).
| Demographics | Rating | Rank | Disability |
| Immigrants | Somalia | 6.8 /100 | #214 | Tragic 12.0% |
| Immigrants | Canada | 6.1 /100 | #215 | Tragic 12.1% |
| Panamanians | 5.4 /100 | #216 | Tragic 12.1% |
| Immigrants | North America | 5.3 /100 | #217 | Tragic 12.1% |
| Immigrants | Jamaica | 5.0 /100 | #218 | Tragic 12.1% |
| Croatians | 4.9 /100 | #219 | Tragic 12.1% |
| Immigrants | Bahamas | 4.7 /100 | #220 | Tragic 12.1% |
| Northern Europeans | 4.2 /100 | #221 | Tragic 12.1% |
| Spanish American Indians | 4.1 /100 | #222 | Tragic 12.1% |
| Hispanics or Latinos | 3.9 /100 | #223 | Tragic 12.1% |
| Mexicans | 3.7 /100 | #224 | Tragic 12.1% |
| Senegalese | 3.5 /100 | #225 | Tragic 12.1% |
| Jamaicans | 3.3 /100 | #226 | Tragic 12.1% |
| Alsatians | 3.3 /100 | #227 | Tragic 12.1% |
| West Indians | 2.9 /100 | #228 | Tragic 12.2% |