Immigrants from South Africa vs Immigrants from Vietnam Vision Disability
COMPARE
Immigrants from South Africa
Immigrants from Vietnam
Vision Disability
Vision Disability Comparison
Immigrants from South Africa
Immigrants from Vietnam
2.1%
VISION DISABILITY
95.4/ 100
METRIC RATING
98th/ 347
METRIC RANK
2.1%
VISION DISABILITY
92.2/ 100
METRIC RATING
115th/ 347
METRIC RANK
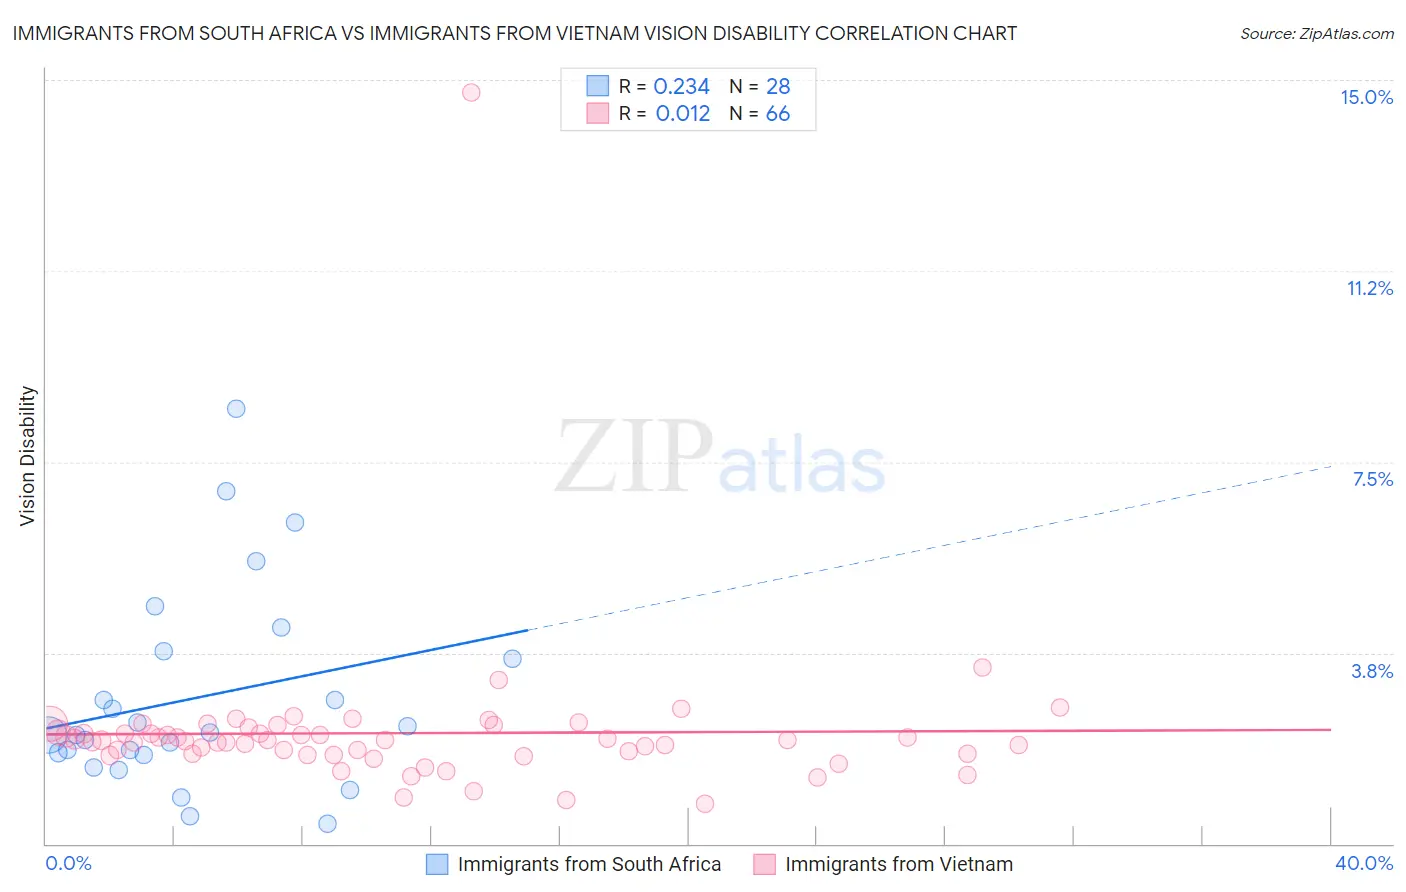
Immigrants from South Africa vs Immigrants from Vietnam Vision Disability Correlation Chart
The statistical analysis conducted on geographies consisting of 233,222,881 people shows a weak positive correlation between the proportion of Immigrants from South Africa and percentage of population with vision disability in the United States with a correlation coefficient (R) of 0.234 and weighted average of 2.1%. Similarly, the statistical analysis conducted on geographies consisting of 404,576,712 people shows no correlation between the proportion of Immigrants from Vietnam and percentage of population with vision disability in the United States with a correlation coefficient (R) of 0.012 and weighted average of 2.1%, a difference of 0.94%.
Vision Disability Correlation Summary
| Measurement | Immigrants from South Africa | Immigrants from Vietnam |
| Minimum | 0.40% | 0.78% |
| Maximum | 8.6% | 14.7% |
| Range | 8.2% | 14.0% |
| Mean | 2.9% | 2.2% |
| Median | 2.2% | 2.0% |
| Interquartile 25% (IQ1) | 1.8% | 1.8% |
| Interquartile 75% (IQ3) | 3.7% | 2.2% |
| Interquartile Range (IQR) | 1.9% | 0.43% |
| Standard Deviation (Sample) | 2.0% | 1.6% |
| Standard Deviation (Population) | 1.9% | 1.6% |
Demographics Similar to Immigrants from South Africa and Immigrants from Vietnam by Vision Disability
In terms of vision disability, the demographic groups most similar to Immigrants from South Africa are Immigrants from Afghanistan (2.1%, a difference of 0.050%), Estonian (2.1%, a difference of 0.070%), Romanian (2.1%, a difference of 0.11%), Greek (2.1%, a difference of 0.11%), and Albanian (2.1%, a difference of 0.19%). Similarly, the demographic groups most similar to Immigrants from Vietnam are Ugandan (2.1%, a difference of 0.0%), Croatian (2.1%, a difference of 0.020%), Kenyan (2.1%, a difference of 0.060%), Immigrants from Denmark (2.1%, a difference of 0.18%), and Peruvian (2.1%, a difference of 0.33%).
| Demographics | Rating | Rank | Vision Disability |
| Romanians | 95.7 /100 | #96 | Exceptional 2.1% |
| Immigrants | Afghanistan | 95.6 /100 | #97 | Exceptional 2.1% |
| Immigrants | South Africa | 95.4 /100 | #98 | Exceptional 2.1% |
| Estonians | 95.3 /100 | #99 | Exceptional 2.1% |
| Greeks | 95.1 /100 | #100 | Exceptional 2.1% |
| Albanians | 94.9 /100 | #101 | Exceptional 2.1% |
| Sri Lankans | 94.8 /100 | #102 | Exceptional 2.1% |
| Immigrants | Austria | 94.4 /100 | #103 | Exceptional 2.1% |
| Immigrants | Italy | 94.4 /100 | #104 | Exceptional 2.1% |
| Carpatho Rusyns | 94.3 /100 | #105 | Exceptional 2.1% |
| Swedes | 94.2 /100 | #106 | Exceptional 2.1% |
| Danes | 94.2 /100 | #107 | Exceptional 2.1% |
| Koreans | 94.1 /100 | #108 | Exceptional 2.1% |
| Chileans | 94.0 /100 | #109 | Exceptional 2.1% |
| Immigrants | Armenia | 93.8 /100 | #110 | Exceptional 2.1% |
| Peruvians | 93.5 /100 | #111 | Exceptional 2.1% |
| Immigrants | Denmark | 92.9 /100 | #112 | Exceptional 2.1% |
| Kenyans | 92.5 /100 | #113 | Exceptional 2.1% |
| Croatians | 92.3 /100 | #114 | Exceptional 2.1% |
| Immigrants | Vietnam | 92.2 /100 | #115 | Exceptional 2.1% |
| Ugandans | 92.2 /100 | #116 | Exceptional 2.1% |