Immigrants from Somalia vs Immigrants from Dominica Vision Disability
COMPARE
Immigrants from Somalia
Immigrants from Dominica
Vision Disability
Vision Disability Comparison
Immigrants from Somalia
Immigrants from Dominica
2.1%
VISION DISABILITY
96.2/ 100
METRIC RATING
91st/ 347
METRIC RANK
2.5%
VISION DISABILITY
0.0/ 100
METRIC RATING
297th/ 347
METRIC RANK
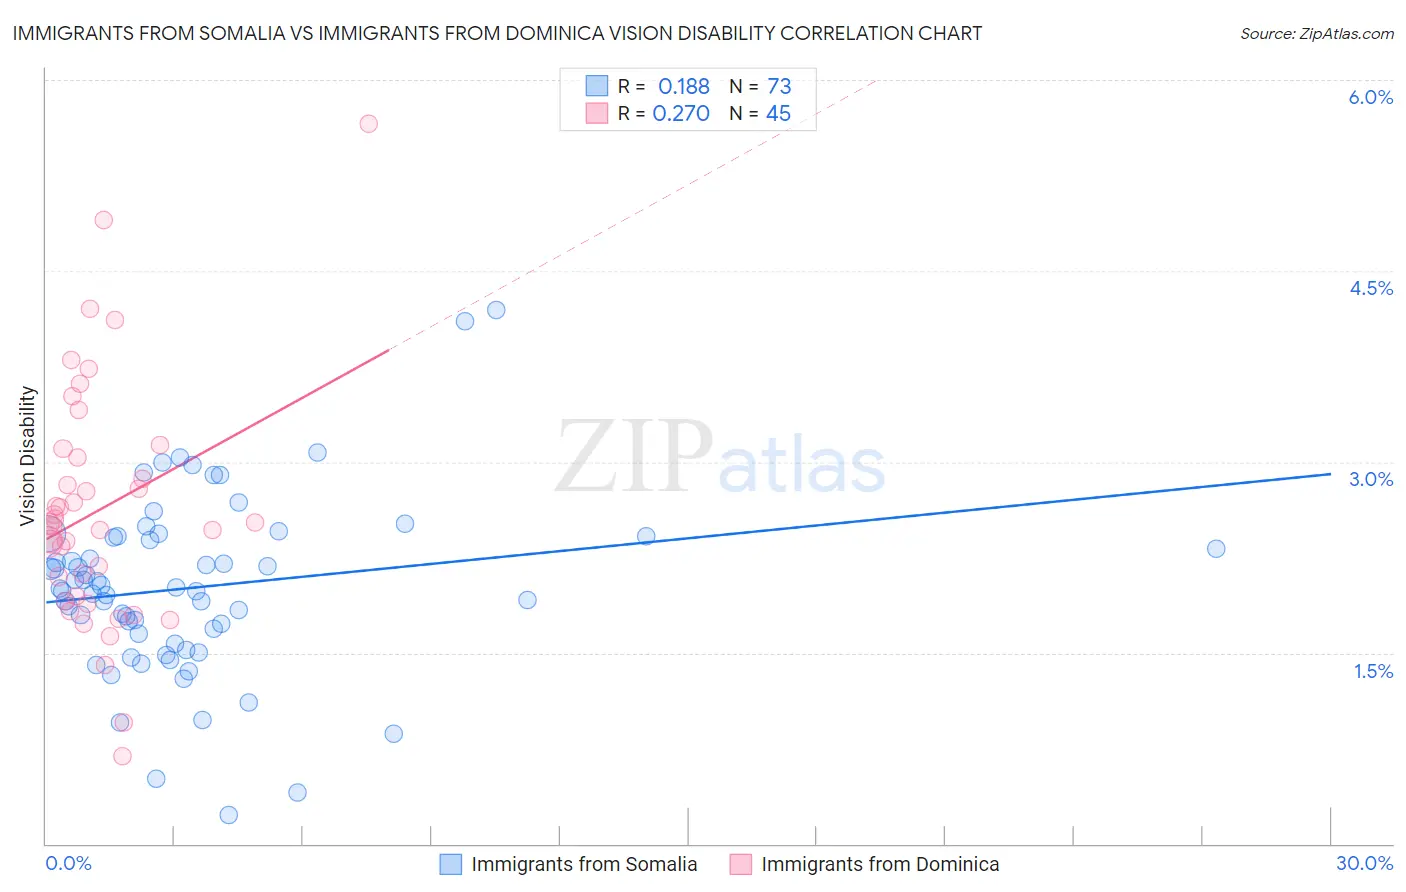
Immigrants from Somalia vs Immigrants from Dominica Vision Disability Correlation Chart
The statistical analysis conducted on geographies consisting of 92,068,110 people shows a poor positive correlation between the proportion of Immigrants from Somalia and percentage of population with vision disability in the United States with a correlation coefficient (R) of 0.188 and weighted average of 2.1%. Similarly, the statistical analysis conducted on geographies consisting of 83,777,112 people shows a weak positive correlation between the proportion of Immigrants from Dominica and percentage of population with vision disability in the United States with a correlation coefficient (R) of 0.270 and weighted average of 2.5%, a difference of 23.0%.
Vision Disability Correlation Summary
| Measurement | Immigrants from Somalia | Immigrants from Dominica |
| Minimum | 0.23% | 0.69% |
| Maximum | 4.2% | 5.7% |
| Range | 4.0% | 5.0% |
| Mean | 2.0% | 2.6% |
| Median | 2.0% | 2.5% |
| Interquartile 25% (IQ1) | 1.6% | 1.9% |
| Interquartile 75% (IQ3) | 2.4% | 3.1% |
| Interquartile Range (IQR) | 0.80% | 1.1% |
| Standard Deviation (Sample) | 0.70% | 0.95% |
| Standard Deviation (Population) | 0.69% | 0.94% |
Similar Demographics by Vision Disability
Demographics Similar to Immigrants from Somalia by Vision Disability
In terms of vision disability, the demographic groups most similar to Immigrants from Somalia are Immigrants from Syria (2.1%, a difference of 0.020%), Immigrants from Europe (2.1%, a difference of 0.060%), Immigrants from Croatia (2.1%, a difference of 0.090%), Australian (2.1%, a difference of 0.16%), and Romanian (2.1%, a difference of 0.22%).
| Demographics | Rating | Rank | Vision Disability |
| Immigrants | Latvia | 97.3 /100 | #84 | Exceptional 2.0% |
| Chinese | 97.2 /100 | #85 | Exceptional 2.0% |
| Immigrants | Moldova | 97.2 /100 | #86 | Exceptional 2.0% |
| Immigrants | Switzerland | 97.0 /100 | #87 | Exceptional 2.0% |
| Norwegians | 97.0 /100 | #88 | Exceptional 2.0% |
| Immigrants | Eastern Africa | 97.0 /100 | #89 | Exceptional 2.0% |
| Immigrants | Lebanon | 96.7 /100 | #90 | Exceptional 2.1% |
| Immigrants | Somalia | 96.2 /100 | #91 | Exceptional 2.1% |
| Immigrants | Syria | 96.2 /100 | #92 | Exceptional 2.1% |
| Immigrants | Europe | 96.1 /100 | #93 | Exceptional 2.1% |
| Immigrants | Croatia | 96.0 /100 | #94 | Exceptional 2.1% |
| Australians | 95.9 /100 | #95 | Exceptional 2.1% |
| Romanians | 95.7 /100 | #96 | Exceptional 2.1% |
| Immigrants | Afghanistan | 95.6 /100 | #97 | Exceptional 2.1% |
| Immigrants | South Africa | 95.4 /100 | #98 | Exceptional 2.1% |
Demographics Similar to Immigrants from Dominica by Vision Disability
In terms of vision disability, the demographic groups most similar to Immigrants from Dominica are Mexican (2.5%, a difference of 0.14%), Cree (2.5%, a difference of 0.17%), African (2.5%, a difference of 0.37%), Menominee (2.5%, a difference of 0.55%), and Immigrants from Mexico (2.5%, a difference of 0.68%).
| Demographics | Rating | Rank | Vision Disability |
| Immigrants | Cuba | 0.0 /100 | #290 | Tragic 2.5% |
| Immigrants | Honduras | 0.0 /100 | #291 | Tragic 2.5% |
| Crow | 0.0 /100 | #292 | Tragic 2.5% |
| Yaqui | 0.0 /100 | #293 | Tragic 2.5% |
| Ottawa | 0.0 /100 | #294 | Tragic 2.5% |
| Delaware | 0.0 /100 | #295 | Tragic 2.5% |
| Immigrants | Mexico | 0.0 /100 | #296 | Tragic 2.5% |
| Immigrants | Dominica | 0.0 /100 | #297 | Tragic 2.5% |
| Mexicans | 0.0 /100 | #298 | Tragic 2.5% |
| Cree | 0.0 /100 | #299 | Tragic 2.5% |
| Africans | 0.0 /100 | #300 | Tragic 2.5% |
| Menominee | 0.0 /100 | #301 | Tragic 2.5% |
| Spanish American Indians | 0.0 /100 | #302 | Tragic 2.6% |
| Immigrants | Cabo Verde | 0.0 /100 | #303 | Tragic 2.6% |
| Aleuts | 0.0 /100 | #304 | Tragic 2.6% |