Immigrants from Singapore vs Panamanian Disability Age 18 to 34
COMPARE
Immigrants from Singapore
Panamanian
Disability Age 18 to 34
Disability Age 18 to 34 Comparison
Immigrants from Singapore
Panamanians
5.7%
DISABILITY AGE 18 TO 34
100.0/ 100
METRIC RATING
25th/ 347
METRIC RANK
6.8%
DISABILITY AGE 18 TO 34
15.8/ 100
METRIC RATING
202nd/ 347
METRIC RANK
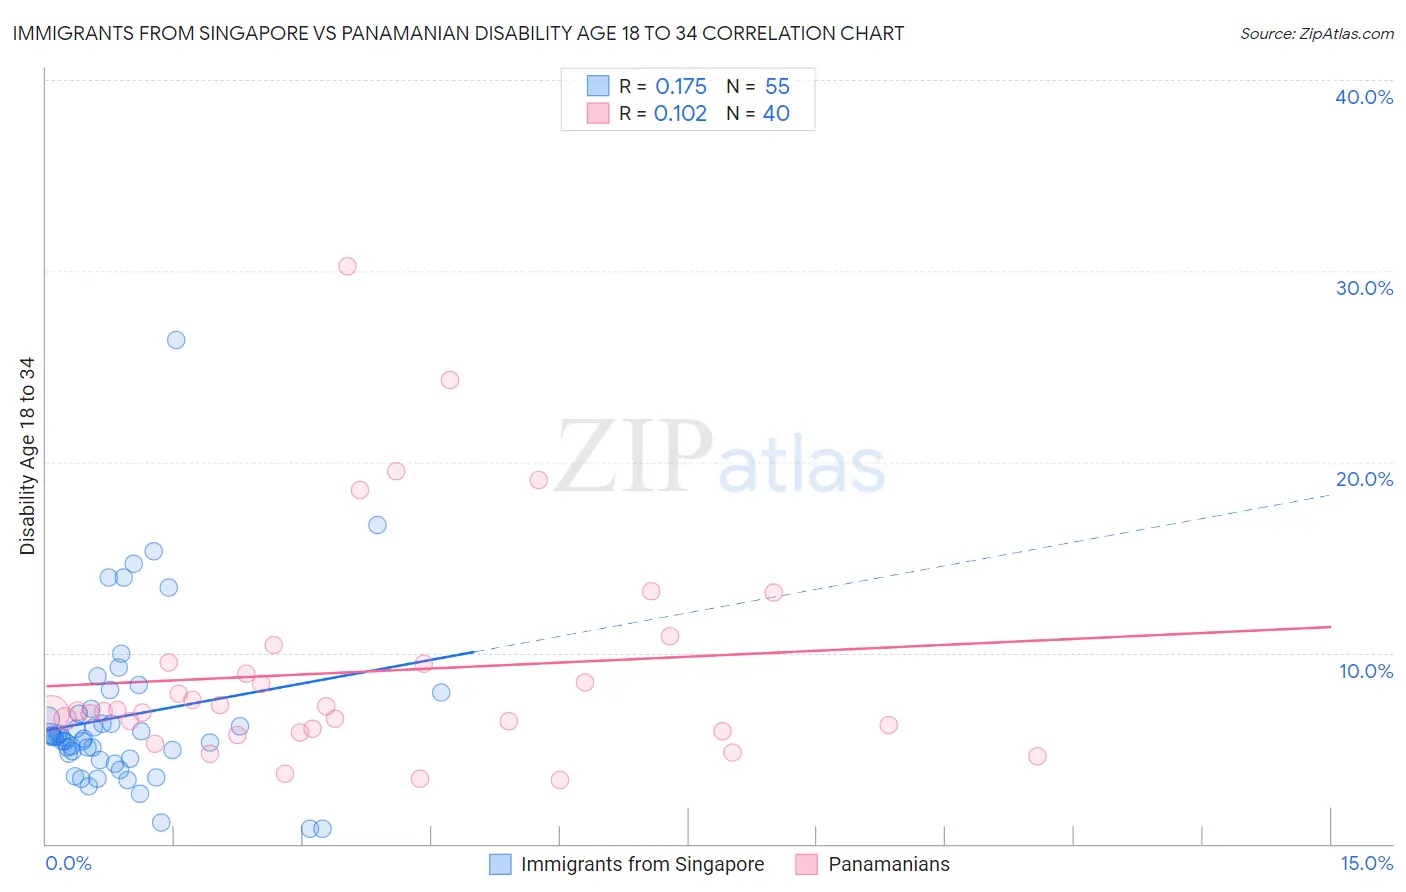
Immigrants from Singapore vs Panamanian Disability Age 18 to 34 Correlation Chart
The statistical analysis conducted on geographies consisting of 137,448,817 people shows a poor positive correlation between the proportion of Immigrants from Singapore and percentage of population with a disability between the ages 18 and 35 in the United States with a correlation coefficient (R) of 0.175 and weighted average of 5.7%. Similarly, the statistical analysis conducted on geographies consisting of 280,999,294 people shows a poor positive correlation between the proportion of Panamanians and percentage of population with a disability between the ages 18 and 35 in the United States with a correlation coefficient (R) of 0.102 and weighted average of 6.8%, a difference of 18.8%.
Disability Age 18 to 34 Correlation Summary
| Measurement | Immigrants from Singapore | Panamanian |
| Minimum | 0.77% | 3.4% |
| Maximum | 26.4% | 30.3% |
| Range | 25.6% | 26.9% |
| Mean | 6.7% | 9.0% |
| Median | 5.6% | 6.9% |
| Interquartile 25% (IQ1) | 4.5% | 6.0% |
| Interquartile 75% (IQ3) | 7.1% | 9.4% |
| Interquartile Range (IQR) | 2.6% | 3.5% |
| Standard Deviation (Sample) | 4.4% | 5.8% |
| Standard Deviation (Population) | 4.4% | 5.7% |
Similar Demographics by Disability Age 18 to 34
Demographics Similar to Immigrants from Singapore by Disability Age 18 to 34
In terms of disability age 18 to 34, the demographic groups most similar to Immigrants from Singapore are Immigrants from Argentina (5.7%, a difference of 0.040%), Cuban (5.7%, a difference of 0.14%), Immigrants from Colombia (5.7%, a difference of 0.15%), Immigrants from Venezuela (5.7%, a difference of 0.26%), and Soviet Union (5.7%, a difference of 0.35%).
| Demographics | Rating | Rank | Disability Age 18 to 34 |
| Immigrants | Bolivia | 100.0 /100 | #18 | Exceptional 5.6% |
| Thais | 100.0 /100 | #19 | Exceptional 5.6% |
| Immigrants | Bangladesh | 100.0 /100 | #20 | Exceptional 5.6% |
| Immigrants | South Central Asia | 100.0 /100 | #21 | Exceptional 5.7% |
| Immigrants | Nicaragua | 100.0 /100 | #22 | Exceptional 5.7% |
| Cubans | 100.0 /100 | #23 | Exceptional 5.7% |
| Immigrants | Argentina | 100.0 /100 | #24 | Exceptional 5.7% |
| Immigrants | Singapore | 100.0 /100 | #25 | Exceptional 5.7% |
| Immigrants | Colombia | 100.0 /100 | #26 | Exceptional 5.7% |
| Immigrants | Venezuela | 99.9 /100 | #27 | Exceptional 5.7% |
| Soviet Union | 99.9 /100 | #28 | Exceptional 5.7% |
| Immigrants | Ecuador | 99.9 /100 | #29 | Exceptional 5.7% |
| Immigrants | Pakistan | 99.9 /100 | #30 | Exceptional 5.8% |
| Iranians | 99.9 /100 | #31 | Exceptional 5.8% |
| Immigrants | Barbados | 99.9 /100 | #32 | Exceptional 5.8% |
Demographics Similar to Panamanians by Disability Age 18 to 34
In terms of disability age 18 to 34, the demographic groups most similar to Panamanians are Greek (6.8%, a difference of 0.040%), Sierra Leonean (6.8%, a difference of 0.21%), Hispanic or Latino (6.8%, a difference of 0.26%), Immigrants from Bosnia and Herzegovina (6.8%, a difference of 0.29%), and Kenyan (6.8%, a difference of 0.30%).
| Demographics | Rating | Rank | Disability Age 18 to 34 |
| Mexican American Indians | 22.3 /100 | #195 | Fair 6.7% |
| Immigrants | Netherlands | 21.0 /100 | #196 | Fair 6.7% |
| Estonians | 20.6 /100 | #197 | Fair 6.8% |
| Australians | 19.4 /100 | #198 | Poor 6.8% |
| Kenyans | 18.3 /100 | #199 | Poor 6.8% |
| Sierra Leoneans | 17.5 /100 | #200 | Poor 6.8% |
| Greeks | 16.1 /100 | #201 | Poor 6.8% |
| Panamanians | 15.8 /100 | #202 | Poor 6.8% |
| Hispanics or Latinos | 13.8 /100 | #203 | Poor 6.8% |
| Immigrants | Bosnia and Herzegovina | 13.6 /100 | #204 | Poor 6.8% |
| Lebanese | 13.3 /100 | #205 | Poor 6.8% |
| Japanese | 12.8 /100 | #206 | Poor 6.8% |
| Mexicans | 12.6 /100 | #207 | Poor 6.8% |
| Immigrants | Scotland | 12.4 /100 | #208 | Poor 6.8% |
| Immigrants | Burma/Myanmar | 12.3 /100 | #209 | Poor 6.8% |