Immigrants from Sierra Leone vs Iraqi Vision Disability
COMPARE
Immigrants from Sierra Leone
Iraqi
Vision Disability
Vision Disability Comparison
Immigrants from Sierra Leone
Iraqis
2.1%
VISION DISABILITY
82.8/ 100
METRIC RATING
143rd/ 347
METRIC RANK
2.1%
VISION DISABILITY
67.7/ 100
METRIC RATING
161st/ 347
METRIC RANK
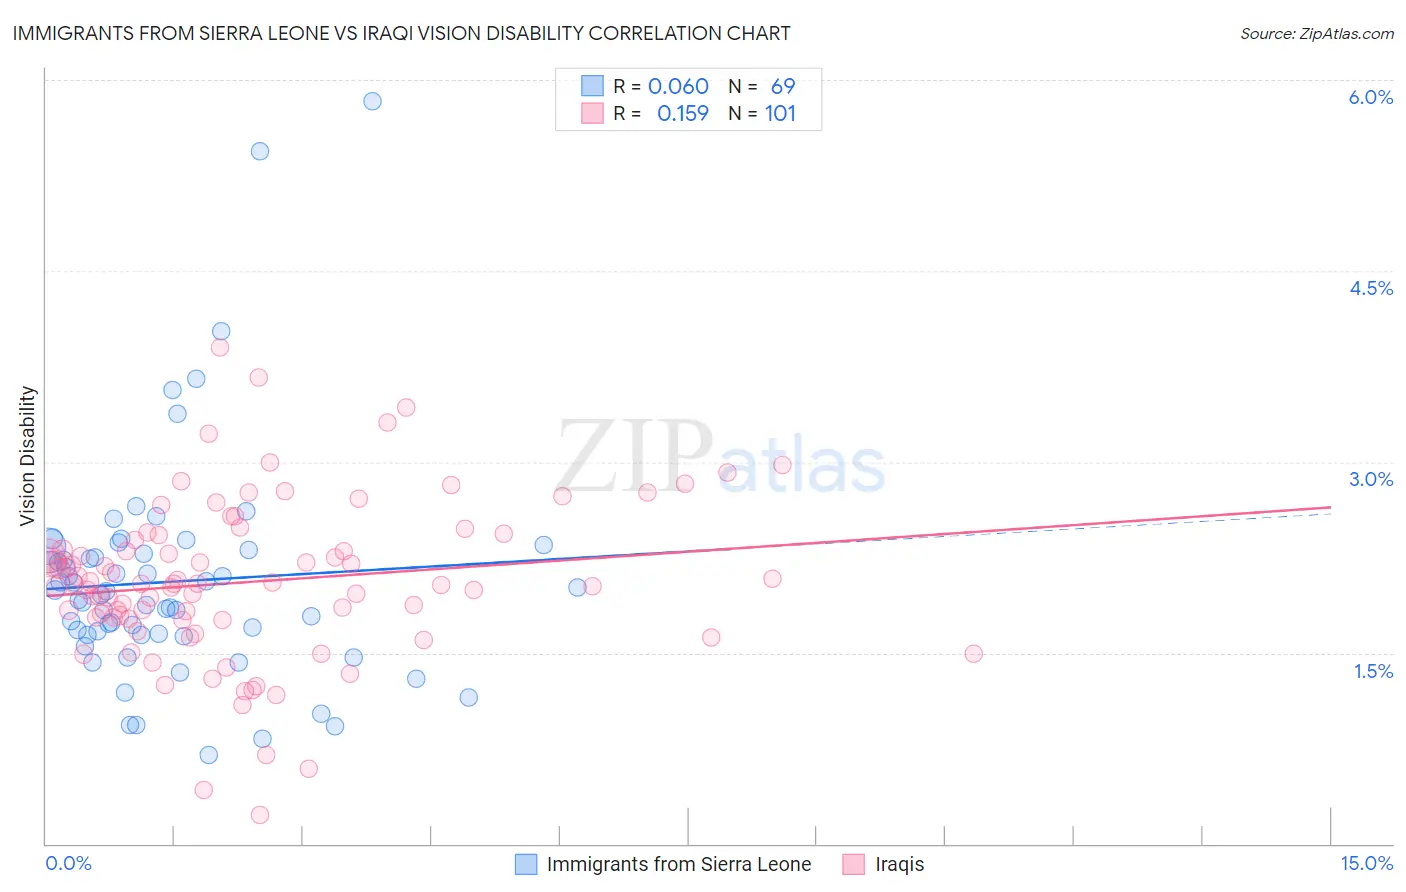
Immigrants from Sierra Leone vs Iraqi Vision Disability Correlation Chart
The statistical analysis conducted on geographies consisting of 101,645,799 people shows a slight positive correlation between the proportion of Immigrants from Sierra Leone and percentage of population with vision disability in the United States with a correlation coefficient (R) of 0.060 and weighted average of 2.1%. Similarly, the statistical analysis conducted on geographies consisting of 170,621,066 people shows a poor positive correlation between the proportion of Iraqis and percentage of population with vision disability in the United States with a correlation coefficient (R) of 0.159 and weighted average of 2.1%, a difference of 1.3%.
Vision Disability Correlation Summary
| Measurement | Immigrants from Sierra Leone | Iraqi |
| Minimum | 0.70% | 0.23% |
| Maximum | 5.8% | 3.9% |
| Range | 5.1% | 3.7% |
| Mean | 2.1% | 2.1% |
| Median | 2.0% | 2.0% |
| Interquartile 25% (IQ1) | 1.6% | 1.8% |
| Interquartile 75% (IQ3) | 2.3% | 2.4% |
| Interquartile Range (IQR) | 0.65% | 0.64% |
| Standard Deviation (Sample) | 0.88% | 0.63% |
| Standard Deviation (Population) | 0.87% | 0.63% |
Demographics Similar to Immigrants from Sierra Leone and Iraqis by Vision Disability
In terms of vision disability, the demographic groups most similar to Immigrants from Sierra Leone are South American (2.1%, a difference of 0.0%), Ukrainian (2.1%, a difference of 0.11%), Immigrants from Bosnia and Herzegovina (2.1%, a difference of 0.15%), Italian (2.1%, a difference of 0.33%), and Immigrants from Sudan (2.1%, a difference of 0.46%). Similarly, the demographic groups most similar to Iraqis are Hungarian (2.1%, a difference of 0.030%), Austrian (2.1%, a difference of 0.090%), South African (2.1%, a difference of 0.15%), Immigrants from Uzbekistan (2.1%, a difference of 0.16%), and Serbian (2.1%, a difference of 0.19%).
| Demographics | Rating | Rank | Vision Disability |
| South Americans | 82.8 /100 | #142 | Excellent 2.1% |
| Immigrants | Sierra Leone | 82.8 /100 | #143 | Excellent 2.1% |
| Ukrainians | 81.9 /100 | #144 | Excellent 2.1% |
| Immigrants | Bosnia and Herzegovina | 81.5 /100 | #145 | Excellent 2.1% |
| Italians | 79.7 /100 | #146 | Good 2.1% |
| Immigrants | Sudan | 78.4 /100 | #147 | Good 2.1% |
| Finns | 78.3 /100 | #148 | Good 2.1% |
| Colombians | 76.2 /100 | #149 | Good 2.1% |
| Belgians | 75.9 /100 | #150 | Good 2.1% |
| Immigrants | Norway | 75.5 /100 | #151 | Good 2.1% |
| Immigrants | Southern Europe | 74.6 /100 | #152 | Good 2.1% |
| Immigrants | South America | 73.8 /100 | #153 | Good 2.1% |
| Slovenes | 73.6 /100 | #154 | Good 2.1% |
| Immigrants | Colombia | 72.1 /100 | #155 | Good 2.1% |
| Pakistanis | 71.6 /100 | #156 | Good 2.1% |
| Serbians | 70.2 /100 | #157 | Good 2.1% |
| Immigrants | Uzbekistan | 69.9 /100 | #158 | Good 2.1% |
| South Africans | 69.8 /100 | #159 | Good 2.1% |
| Austrians | 69.0 /100 | #160 | Good 2.1% |
| Iraqis | 67.7 /100 | #161 | Good 2.1% |
| Hungarians | 67.4 /100 | #162 | Good 2.1% |