Immigrants from Serbia vs Ecuadorian Disability
COMPARE
Immigrants from Serbia
Ecuadorian
Disability
Disability Comparison
Immigrants from Serbia
Ecuadorians
11.0%
DISABILITY
99.4/ 100
METRIC RATING
74th/ 347
METRIC RANK
11.2%
DISABILITY
98.0/ 100
METRIC RATING
92nd/ 347
METRIC RANK
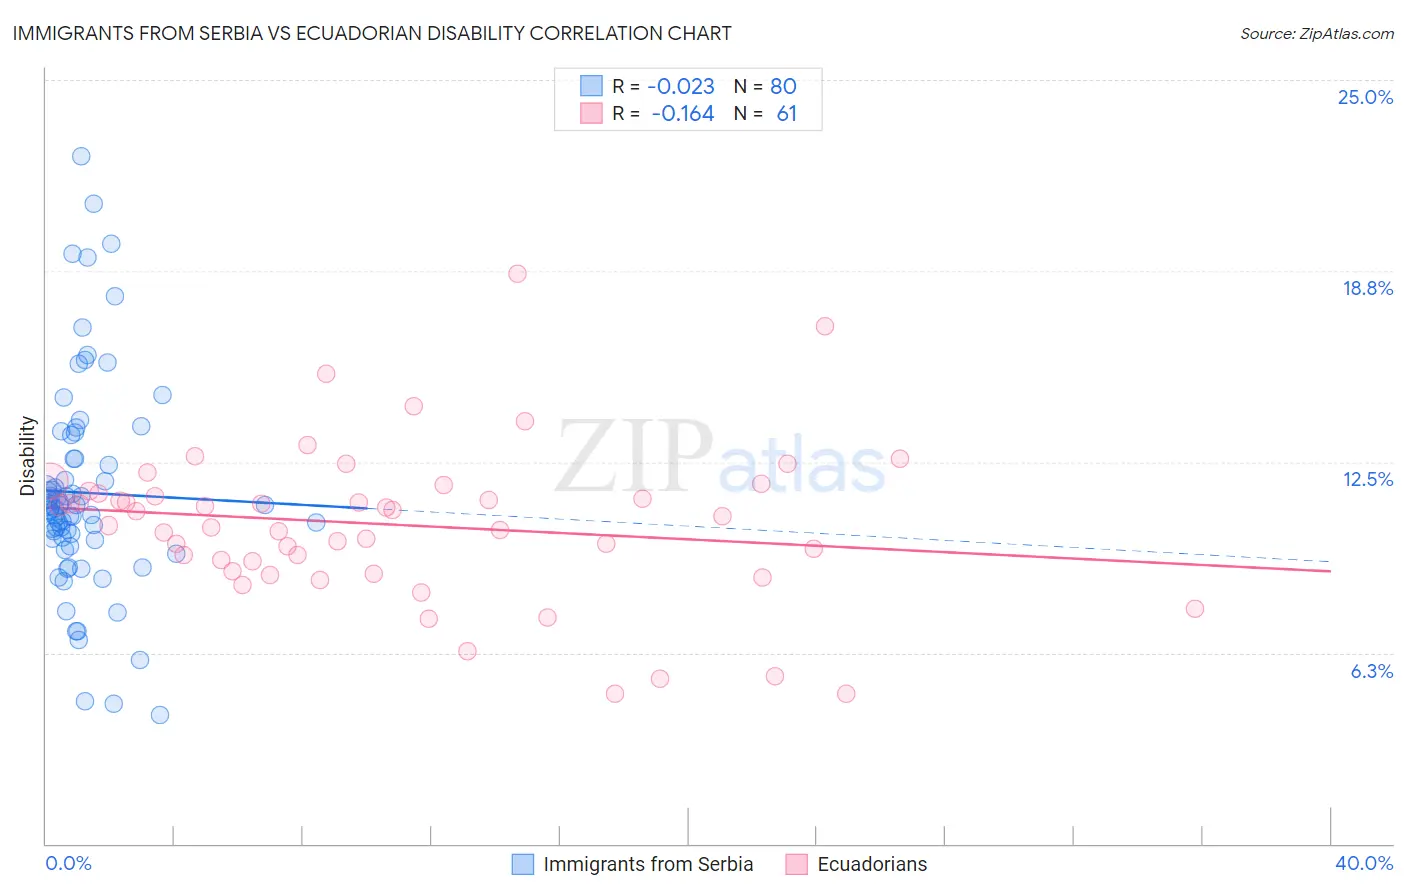
Immigrants from Serbia vs Ecuadorian Disability Correlation Chart
The statistical analysis conducted on geographies consisting of 131,748,462 people shows no correlation between the proportion of Immigrants from Serbia and percentage of population with a disability in the United States with a correlation coefficient (R) of -0.023 and weighted average of 11.0%. Similarly, the statistical analysis conducted on geographies consisting of 317,822,544 people shows a poor negative correlation between the proportion of Ecuadorians and percentage of population with a disability in the United States with a correlation coefficient (R) of -0.164 and weighted average of 11.2%, a difference of 1.4%.
Disability Correlation Summary
| Measurement | Immigrants from Serbia | Ecuadorian |
| Minimum | 4.2% | 4.9% |
| Maximum | 22.5% | 18.7% |
| Range | 18.3% | 13.8% |
| Mean | 11.5% | 10.4% |
| Median | 11.0% | 10.7% |
| Interquartile 25% (IQ1) | 10.0% | 9.1% |
| Interquartile 75% (IQ3) | 12.6% | 11.5% |
| Interquartile Range (IQR) | 2.6% | 2.4% |
| Standard Deviation (Sample) | 3.5% | 2.5% |
| Standard Deviation (Population) | 3.4% | 2.5% |
Demographics Similar to Immigrants from Serbia and Ecuadorians by Disability
In terms of disability, the demographic groups most similar to Immigrants from Serbia are Immigrants from Bangladesh (11.0%, a difference of 0.020%), Immigrants from Vietnam (11.0%, a difference of 0.020%), Sierra Leonean (11.0%, a difference of 0.050%), Immigrants from Belgium (11.0%, a difference of 0.050%), and Immigrants from Cameroon (11.1%, a difference of 0.090%). Similarly, the demographic groups most similar to Ecuadorians are Immigrants from Ecuador (11.2%, a difference of 0.0%), Immigrants from Western Asia (11.2%, a difference of 0.040%), Immigrants from Brazil (11.2%, a difference of 0.060%), Immigrants from South Africa (11.2%, a difference of 0.11%), and Immigrants from Romania (11.2%, a difference of 0.36%).
| Demographics | Rating | Rank | Disability |
| Immigrants | Bangladesh | 99.4 /100 | #73 | Exceptional 11.0% |
| Immigrants | Serbia | 99.4 /100 | #74 | Exceptional 11.0% |
| Immigrants | Vietnam | 99.4 /100 | #75 | Exceptional 11.0% |
| Sierra Leoneans | 99.3 /100 | #76 | Exceptional 11.0% |
| Immigrants | Belgium | 99.3 /100 | #77 | Exceptional 11.0% |
| Immigrants | Cameroon | 99.3 /100 | #78 | Exceptional 11.1% |
| Immigrants | Jordan | 99.3 /100 | #79 | Exceptional 11.1% |
| Immigrants | Ireland | 99.3 /100 | #80 | Exceptional 11.1% |
| Immigrants | Poland | 99.1 /100 | #81 | Exceptional 11.1% |
| Chileans | 99.1 /100 | #82 | Exceptional 11.1% |
| Immigrants | Switzerland | 99.0 /100 | #83 | Exceptional 11.1% |
| Immigrants | Sierra Leone | 99.0 /100 | #84 | Exceptional 11.1% |
| Immigrants | Belarus | 98.9 /100 | #85 | Exceptional 11.1% |
| Immigrants | Russia | 98.9 /100 | #86 | Exceptional 11.1% |
| Palestinians | 98.9 /100 | #87 | Exceptional 11.1% |
| Immigrants | Romania | 98.5 /100 | #88 | Exceptional 11.2% |
| Immigrants | South Africa | 98.2 /100 | #89 | Exceptional 11.2% |
| Immigrants | Brazil | 98.1 /100 | #90 | Exceptional 11.2% |
| Immigrants | Western Asia | 98.1 /100 | #91 | Exceptional 11.2% |
| Ecuadorians | 98.0 /100 | #92 | Exceptional 11.2% |
| Immigrants | Ecuador | 98.0 /100 | #93 | Exceptional 11.2% |