Immigrants from Senegal vs Immigrants from Hungary Disability Age 65 to 74
COMPARE
Immigrants from Senegal
Immigrants from Hungary
Disability Age 65 to 74
Disability Age 65 to 74 Comparison
Immigrants from Senegal
Immigrants from Hungary
24.6%
DISABILITY AGE 65 TO 74
2.2/ 100
METRIC RATING
242nd/ 347
METRIC RANK
21.7%
DISABILITY AGE 65 TO 74
99.2/ 100
METRIC RATING
72nd/ 347
METRIC RANK
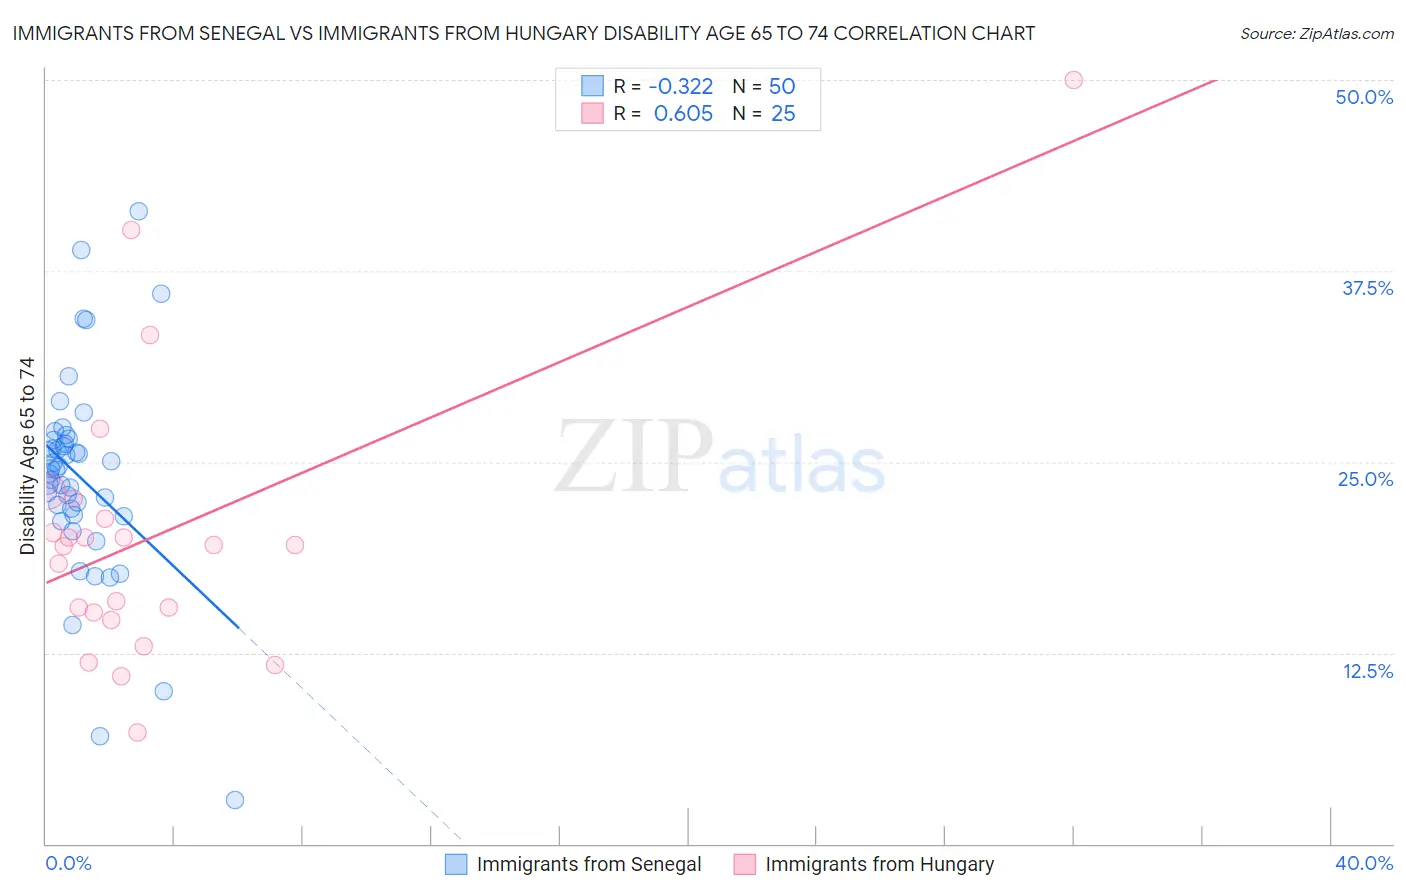
Immigrants from Senegal vs Immigrants from Hungary Disability Age 65 to 74 Correlation Chart
The statistical analysis conducted on geographies consisting of 90,101,163 people shows a mild negative correlation between the proportion of Immigrants from Senegal and percentage of population with a disability between the ages 65 and 75 in the United States with a correlation coefficient (R) of -0.322 and weighted average of 24.6%. Similarly, the statistical analysis conducted on geographies consisting of 195,586,692 people shows a significant positive correlation between the proportion of Immigrants from Hungary and percentage of population with a disability between the ages 65 and 75 in the United States with a correlation coefficient (R) of 0.605 and weighted average of 21.7%, a difference of 13.4%.
Disability Age 65 to 74 Correlation Summary
| Measurement | Immigrants from Senegal | Immigrants from Hungary |
| Minimum | 2.9% | 7.3% |
| Maximum | 41.4% | 50.0% |
| Range | 38.5% | 42.7% |
| Mean | 24.0% | 20.3% |
| Median | 24.5% | 19.6% |
| Interquartile 25% (IQ1) | 21.6% | 14.9% |
| Interquartile 75% (IQ3) | 26.4% | 21.9% |
| Interquartile Range (IQR) | 4.8% | 7.0% |
| Standard Deviation (Sample) | 6.8% | 9.3% |
| Standard Deviation (Population) | 6.8% | 9.2% |
Similar Demographics by Disability Age 65 to 74
Demographics Similar to Immigrants from Senegal by Disability Age 65 to 74
In terms of disability age 65 to 74, the demographic groups most similar to Immigrants from Senegal are Spanish (24.6%, a difference of 0.010%), Immigrants from Western Africa (24.6%, a difference of 0.080%), Armenian (24.7%, a difference of 0.14%), British West Indian (24.7%, a difference of 0.14%), and Spaniard (24.6%, a difference of 0.16%).
| Demographics | Rating | Rank | Disability Age 65 to 74 |
| Scotch-Irish | 3.8 /100 | #235 | Tragic 24.4% |
| German Russians | 3.7 /100 | #236 | Tragic 24.4% |
| West Indians | 3.4 /100 | #237 | Tragic 24.5% |
| Immigrants | Ghana | 3.0 /100 | #238 | Tragic 24.5% |
| Immigrants | Caribbean | 2.6 /100 | #239 | Tragic 24.6% |
| Spaniards | 2.4 /100 | #240 | Tragic 24.6% |
| Immigrants | Western Africa | 2.3 /100 | #241 | Tragic 24.6% |
| Immigrants | Senegal | 2.2 /100 | #242 | Tragic 24.6% |
| Spanish | 2.2 /100 | #243 | Tragic 24.6% |
| Armenians | 2.0 /100 | #244 | Tragic 24.7% |
| British West Indians | 2.0 /100 | #245 | Tragic 24.7% |
| Immigrants | Iraq | 1.9 /100 | #246 | Tragic 24.7% |
| Indonesians | 1.1 /100 | #247 | Tragic 24.9% |
| Senegalese | 0.9 /100 | #248 | Tragic 24.9% |
| Immigrants | Fiji | 0.8 /100 | #249 | Tragic 25.0% |
Demographics Similar to Immigrants from Hungary by Disability Age 65 to 74
In terms of disability age 65 to 74, the demographic groups most similar to Immigrants from Hungary are Immigrants from Belarus (21.7%, a difference of 0.010%), Immigrants from Egypt (21.7%, a difference of 0.070%), Chinese (21.7%, a difference of 0.070%), Immigrants from Venezuela (21.8%, a difference of 0.19%), and Immigrants from Scotland (21.7%, a difference of 0.20%).
| Demographics | Rating | Rank | Disability Age 65 to 74 |
| Immigrants | Russia | 99.4 /100 | #65 | Exceptional 21.6% |
| Maltese | 99.4 /100 | #66 | Exceptional 21.6% |
| Immigrants | South Africa | 99.3 /100 | #67 | Exceptional 21.7% |
| Immigrants | Scotland | 99.3 /100 | #68 | Exceptional 21.7% |
| Immigrants | Egypt | 99.2 /100 | #69 | Exceptional 21.7% |
| Chinese | 99.2 /100 | #70 | Exceptional 21.7% |
| Immigrants | Belarus | 99.2 /100 | #71 | Exceptional 21.7% |
| Immigrants | Hungary | 99.2 /100 | #72 | Exceptional 21.7% |
| Immigrants | Venezuela | 99.0 /100 | #73 | Exceptional 21.8% |
| Cambodians | 99.0 /100 | #74 | Exceptional 21.8% |
| Mongolians | 99.0 /100 | #75 | Exceptional 21.8% |
| Greeks | 99.0 /100 | #76 | Exceptional 21.8% |
| Immigrants | Poland | 99.0 /100 | #77 | Exceptional 21.8% |
| Immigrants | Eastern Europe | 99.0 /100 | #78 | Exceptional 21.8% |
| Venezuelans | 99.0 /100 | #79 | Exceptional 21.8% |