Immigrants from Saudi Arabia vs Immigrants from Dominican Republic Disability Age Over 75
COMPARE
Immigrants from Saudi Arabia
Immigrants from Dominican Republic
Disability Age Over 75
Disability Age Over 75 Comparison
Immigrants from Saudi Arabia
Immigrants from Dominican Republic
46.3%
DISABILITY AGE OVER 75
98.4/ 100
METRIC RATING
89th/ 347
METRIC RANK
50.3%
DISABILITY AGE OVER 75
0.0/ 100
METRIC RATING
304th/ 347
METRIC RANK
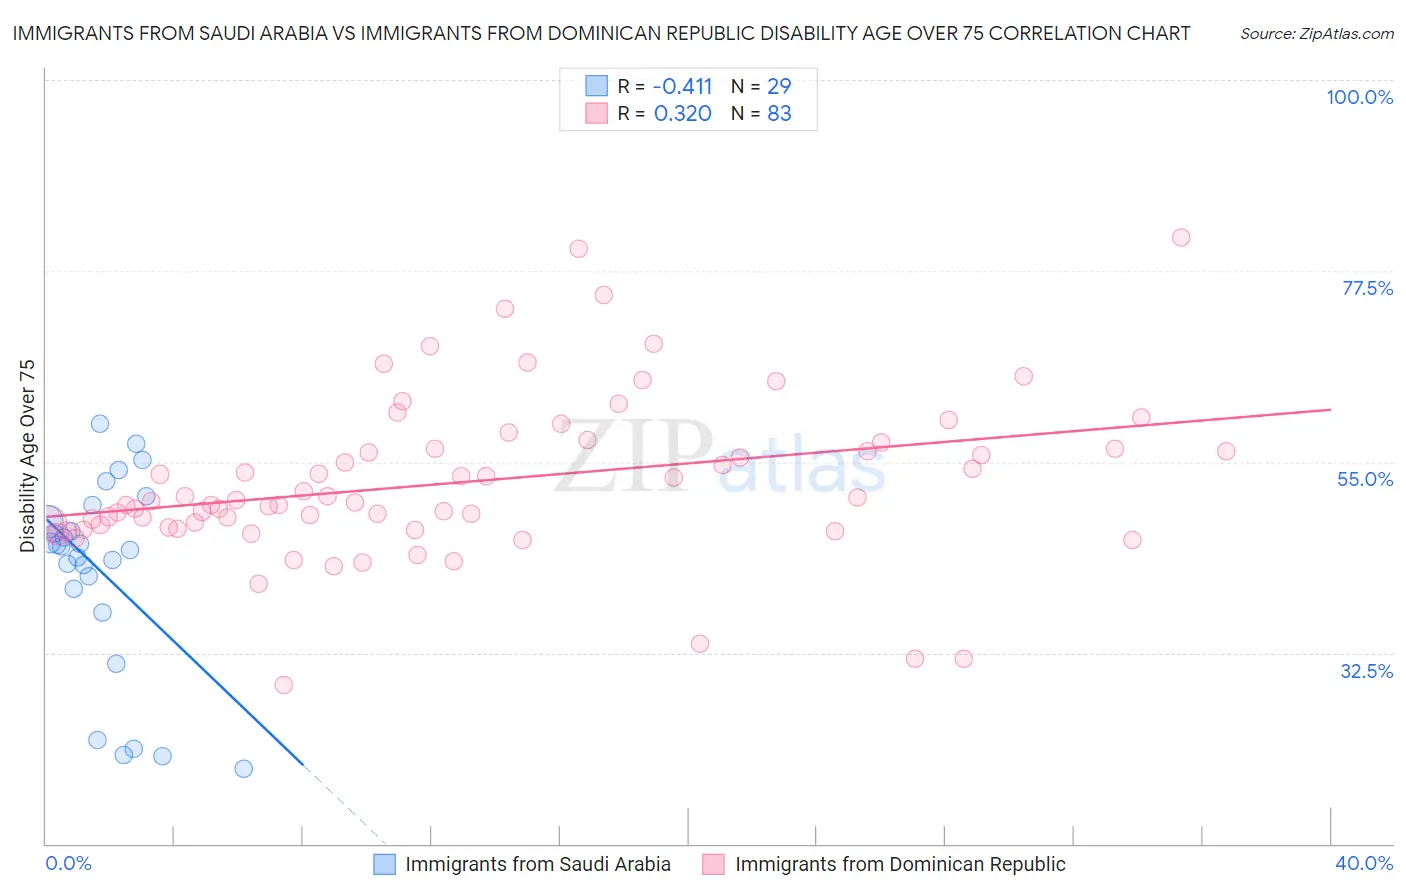
Immigrants from Saudi Arabia vs Immigrants from Dominican Republic Disability Age Over 75 Correlation Chart
The statistical analysis conducted on geographies consisting of 164,150,377 people shows a moderate negative correlation between the proportion of Immigrants from Saudi Arabia and percentage of population with a disability over the age of 75 in the United States with a correlation coefficient (R) of -0.411 and weighted average of 46.3%. Similarly, the statistical analysis conducted on geographies consisting of 274,580,835 people shows a mild positive correlation between the proportion of Immigrants from Dominican Republic and percentage of population with a disability over the age of 75 in the United States with a correlation coefficient (R) of 0.320 and weighted average of 50.3%, a difference of 8.7%.
Disability Age Over 75 Correlation Summary
| Measurement | Immigrants from Saudi Arabia | Immigrants from Dominican Republic |
| Minimum | 18.9% | 28.7% |
| Maximum | 59.5% | 81.4% |
| Range | 40.7% | 52.8% |
| Mean | 42.0% | 52.6% |
| Median | 45.1% | 50.4% |
| Interquartile 25% (IQ1) | 38.6% | 47.3% |
| Interquartile 75% (IQ3) | 49.0% | 56.6% |
| Interquartile Range (IQR) | 10.3% | 9.3% |
| Standard Deviation (Sample) | 11.5% | 9.6% |
| Standard Deviation (Population) | 11.3% | 9.5% |
Similar Demographics by Disability Age Over 75
Demographics Similar to Immigrants from Saudi Arabia by Disability Age Over 75
In terms of disability age over 75, the demographic groups most similar to Immigrants from Saudi Arabia are Uruguayan (46.2%, a difference of 0.010%), Northern European (46.3%, a difference of 0.010%), Immigrants from Egypt (46.3%, a difference of 0.020%), German (46.3%, a difference of 0.070%), and Ugandan (46.3%, a difference of 0.070%).
| Demographics | Rating | Rank | Disability Age Over 75 |
| Immigrants | Latvia | 98.7 /100 | #82 | Exceptional 46.2% |
| Argentineans | 98.7 /100 | #83 | Exceptional 46.2% |
| Immigrants | Jordan | 98.7 /100 | #84 | Exceptional 46.2% |
| Immigrants | Southern Europe | 98.6 /100 | #85 | Exceptional 46.2% |
| Romanians | 98.6 /100 | #86 | Exceptional 46.2% |
| Danes | 98.6 /100 | #87 | Exceptional 46.2% |
| Uruguayans | 98.4 /100 | #88 | Exceptional 46.2% |
| Immigrants | Saudi Arabia | 98.4 /100 | #89 | Exceptional 46.3% |
| Northern Europeans | 98.3 /100 | #90 | Exceptional 46.3% |
| Immigrants | Egypt | 98.3 /100 | #91 | Exceptional 46.3% |
| Germans | 98.2 /100 | #92 | Exceptional 46.3% |
| Ugandans | 98.2 /100 | #93 | Exceptional 46.3% |
| Albanians | 98.1 /100 | #94 | Exceptional 46.3% |
| Immigrants | Brazil | 98.0 /100 | #95 | Exceptional 46.3% |
| Immigrants | China | 98.0 /100 | #96 | Exceptional 46.3% |
Demographics Similar to Immigrants from Dominican Republic by Disability Age Over 75
In terms of disability age over 75, the demographic groups most similar to Immigrants from Dominican Republic are Japanese (50.2%, a difference of 0.11%), Cherokee (50.2%, a difference of 0.12%), Dominican (50.2%, a difference of 0.28%), Cape Verdean (50.1%, a difference of 0.34%), and Immigrants from Micronesia (50.1%, a difference of 0.37%).
| Demographics | Rating | Rank | Disability Age Over 75 |
| Armenians | 0.0 /100 | #297 | Tragic 50.0% |
| Marshallese | 0.0 /100 | #298 | Tragic 50.1% |
| Immigrants | Micronesia | 0.0 /100 | #299 | Tragic 50.1% |
| Cape Verdeans | 0.0 /100 | #300 | Tragic 50.1% |
| Dominicans | 0.0 /100 | #301 | Tragic 50.2% |
| Cherokee | 0.0 /100 | #302 | Tragic 50.2% |
| Japanese | 0.0 /100 | #303 | Tragic 50.2% |
| Immigrants | Dominican Republic | 0.0 /100 | #304 | Tragic 50.3% |
| Central American Indians | 0.0 /100 | #305 | Tragic 50.5% |
| Immigrants | Central America | 0.0 /100 | #306 | Tragic 50.5% |
| Immigrants | Fiji | 0.0 /100 | #307 | Tragic 50.6% |
| Hispanics or Latinos | 0.0 /100 | #308 | Tragic 50.6% |
| Aleuts | 0.0 /100 | #309 | Tragic 50.6% |
| Tlingit-Haida | 0.0 /100 | #310 | Tragic 50.6% |
| Cajuns | 0.0 /100 | #311 | Tragic 50.7% |