Immigrants from Russia vs Nicaraguan Cognitive Disability
COMPARE
Immigrants from Russia
Nicaraguan
Cognitive Disability
Cognitive Disability Comparison
Immigrants from Russia
Nicaraguans
16.8%
COGNITIVE DISABILITY
98.2/ 100
METRIC RATING
100th/ 347
METRIC RANK
17.0%
COGNITIVE DISABILITY
93.0/ 100
METRIC RATING
128th/ 347
METRIC RANK
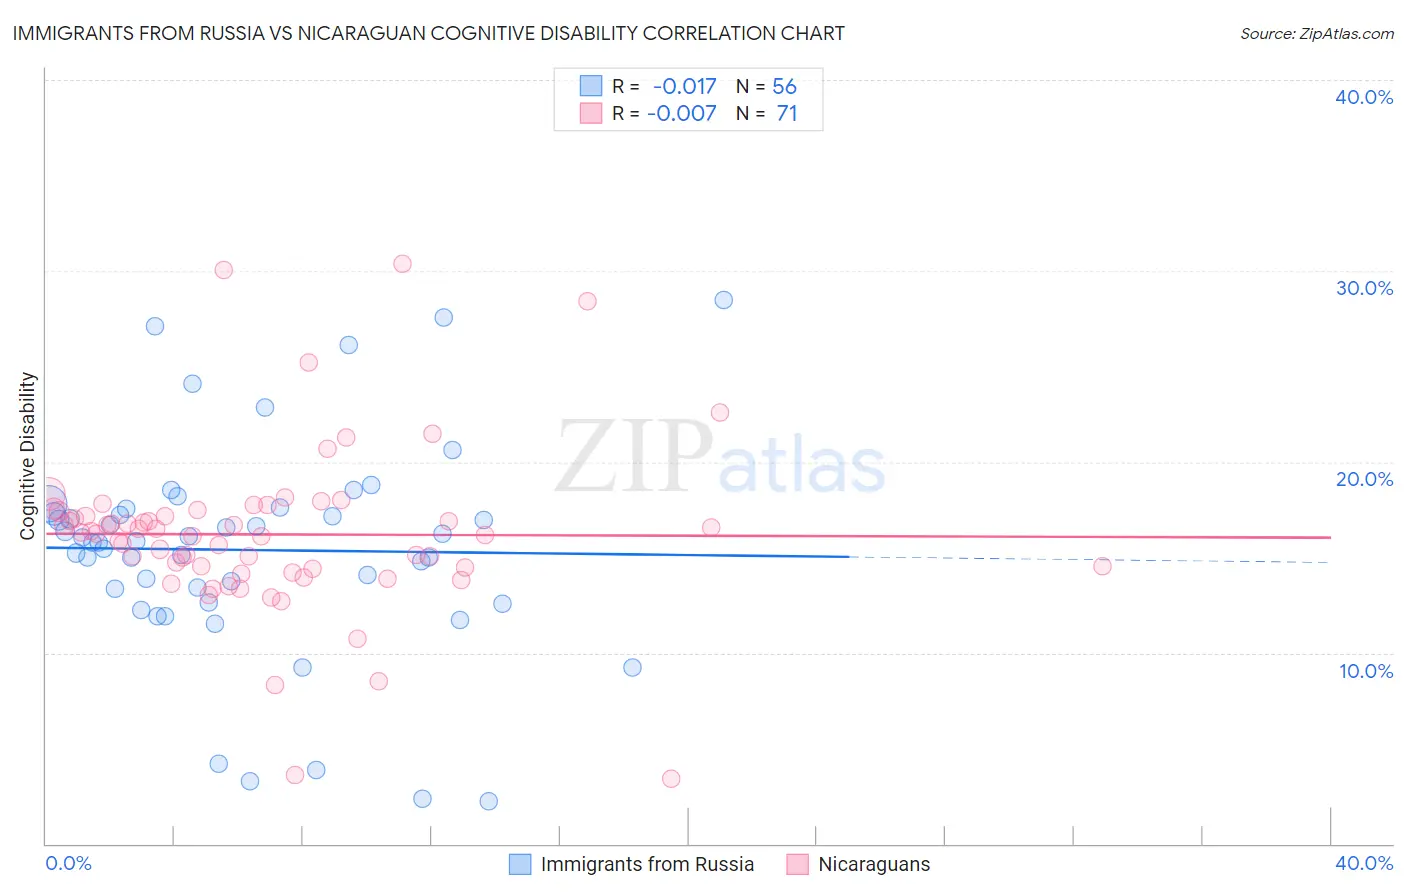
Immigrants from Russia vs Nicaraguan Cognitive Disability Correlation Chart
The statistical analysis conducted on geographies consisting of 347,925,749 people shows no correlation between the proportion of Immigrants from Russia and percentage of population with cognitive disability in the United States with a correlation coefficient (R) of -0.017 and weighted average of 16.8%. Similarly, the statistical analysis conducted on geographies consisting of 285,693,430 people shows no correlation between the proportion of Nicaraguans and percentage of population with cognitive disability in the United States with a correlation coefficient (R) of -0.007 and weighted average of 17.0%, a difference of 1.0%.
Cognitive Disability Correlation Summary
| Measurement | Immigrants from Russia | Nicaraguan |
| Minimum | 2.3% | 3.4% |
| Maximum | 28.5% | 30.4% |
| Range | 26.2% | 26.9% |
| Mean | 15.4% | 16.2% |
| Median | 15.8% | 16.2% |
| Interquartile 25% (IQ1) | 13.0% | 14.4% |
| Interquartile 75% (IQ3) | 17.4% | 17.4% |
| Interquartile Range (IQR) | 4.4% | 3.0% |
| Standard Deviation (Sample) | 5.6% | 4.4% |
| Standard Deviation (Population) | 5.6% | 4.4% |
Similar Demographics by Cognitive Disability
Demographics Similar to Immigrants from Russia by Cognitive Disability
In terms of cognitive disability, the demographic groups most similar to Immigrants from Russia are Immigrants from Asia (16.8%, a difference of 0.0%), Jordanian (16.8%, a difference of 0.030%), Irish (16.8%, a difference of 0.030%), Paraguayan (16.8%, a difference of 0.080%), and Palestinian (16.8%, a difference of 0.080%).
| Demographics | Rating | Rank | Cognitive Disability |
| Immigrants | Southern Europe | 98.7 /100 | #93 | Exceptional 16.7% |
| Asians | 98.7 /100 | #94 | Exceptional 16.7% |
| English | 98.6 /100 | #95 | Exceptional 16.8% |
| Finns | 98.5 /100 | #96 | Exceptional 16.8% |
| Dutch | 98.5 /100 | #97 | Exceptional 16.8% |
| Immigrants | Lebanon | 98.4 /100 | #98 | Exceptional 16.8% |
| Jordanians | 98.2 /100 | #99 | Exceptional 16.8% |
| Immigrants | Russia | 98.2 /100 | #100 | Exceptional 16.8% |
| Immigrants | Asia | 98.1 /100 | #101 | Exceptional 16.8% |
| Irish | 98.1 /100 | #102 | Exceptional 16.8% |
| Paraguayans | 98.0 /100 | #103 | Exceptional 16.8% |
| Palestinians | 98.0 /100 | #104 | Exceptional 16.8% |
| Immigrants | Eastern Asia | 97.9 /100 | #105 | Exceptional 16.8% |
| Northern Europeans | 97.8 /100 | #106 | Exceptional 16.8% |
| Immigrants | Nicaragua | 97.8 /100 | #107 | Exceptional 16.8% |
Demographics Similar to Nicaraguans by Cognitive Disability
In terms of cognitive disability, the demographic groups most similar to Nicaraguans are Immigrants from Costa Rica (17.0%, a difference of 0.010%), Immigrants from Uruguay (17.0%, a difference of 0.010%), European (17.0%, a difference of 0.050%), Immigrants from Vietnam (17.0%, a difference of 0.070%), and Immigrants from Germany (17.0%, a difference of 0.090%).
| Demographics | Rating | Rank | Cognitive Disability |
| Immigrants | China | 94.9 /100 | #121 | Exceptional 16.9% |
| Immigrants | Western Europe | 94.8 /100 | #122 | Exceptional 16.9% |
| Portuguese | 94.7 /100 | #123 | Exceptional 16.9% |
| Turks | 94.5 /100 | #124 | Exceptional 16.9% |
| Scandinavians | 94.1 /100 | #125 | Exceptional 16.9% |
| Europeans | 93.4 /100 | #126 | Exceptional 17.0% |
| Immigrants | Costa Rica | 93.1 /100 | #127 | Exceptional 17.0% |
| Nicaraguans | 93.0 /100 | #128 | Exceptional 17.0% |
| Immigrants | Uruguay | 92.9 /100 | #129 | Exceptional 17.0% |
| Immigrants | Vietnam | 92.4 /100 | #130 | Exceptional 17.0% |
| Immigrants | Germany | 92.1 /100 | #131 | Exceptional 17.0% |
| Whites/Caucasians | 92.1 /100 | #132 | Exceptional 17.0% |
| Immigrants | Jordan | 91.9 /100 | #133 | Exceptional 17.0% |
| Immigrants | Chile | 91.7 /100 | #134 | Exceptional 17.0% |
| Lebanese | 91.3 /100 | #135 | Exceptional 17.0% |