Immigrants from Poland vs Immigrants from Greece Vision Disability
COMPARE
Immigrants from Poland
Immigrants from Greece
Vision Disability
Vision Disability Comparison
Immigrants from Poland
Immigrants from Greece
2.0%
VISION DISABILITY
97.6/ 100
METRIC RATING
82nd/ 347
METRIC RANK
2.0%
VISION DISABILITY
99.0/ 100
METRIC RATING
64th/ 347
METRIC RANK
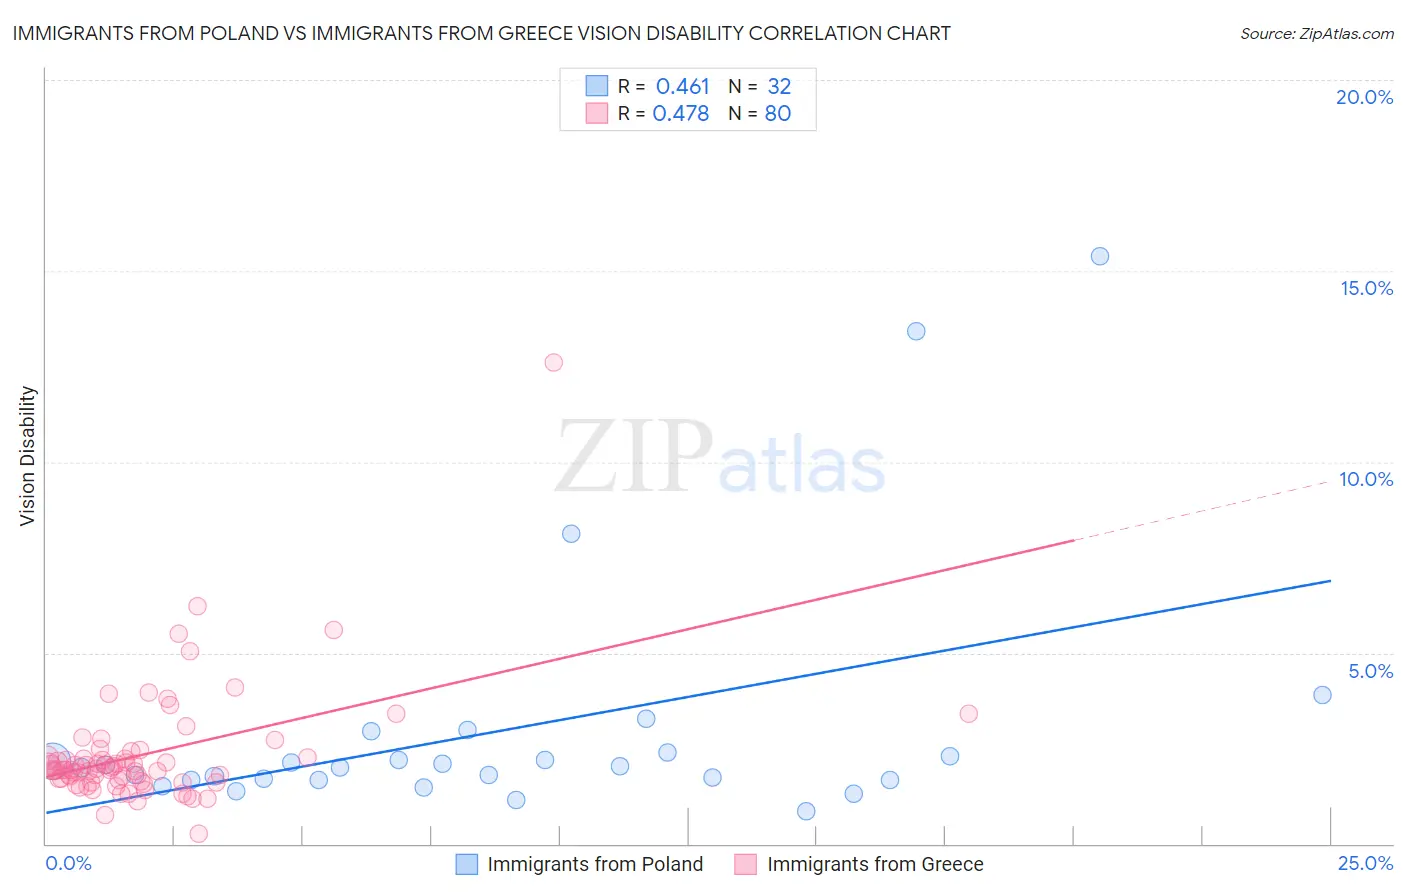
Immigrants from Poland vs Immigrants from Greece Vision Disability Correlation Chart
The statistical analysis conducted on geographies consisting of 304,657,197 people shows a moderate positive correlation between the proportion of Immigrants from Poland and percentage of population with vision disability in the United States with a correlation coefficient (R) of 0.461 and weighted average of 2.0%. Similarly, the statistical analysis conducted on geographies consisting of 216,813,822 people shows a moderate positive correlation between the proportion of Immigrants from Greece and percentage of population with vision disability in the United States with a correlation coefficient (R) of 0.478 and weighted average of 2.0%, a difference of 1.5%.
Vision Disability Correlation Summary
| Measurement | Immigrants from Poland | Immigrants from Greece |
| Minimum | 0.85% | 0.27% |
| Maximum | 15.4% | 12.6% |
| Range | 14.5% | 12.3% |
| Mean | 3.0% | 2.3% |
| Median | 2.0% | 1.9% |
| Interquartile 25% (IQ1) | 1.7% | 1.7% |
| Interquartile 75% (IQ3) | 2.3% | 2.3% |
| Interquartile Range (IQR) | 0.66% | 0.60% |
| Standard Deviation (Sample) | 3.3% | 1.6% |
| Standard Deviation (Population) | 3.2% | 1.6% |
Demographics Similar to Immigrants from Poland and Immigrants from Greece by Vision Disability
In terms of vision disability, the demographic groups most similar to Immigrants from Poland are Soviet Union (2.0%, a difference of 0.020%), Immigrants from Western Asia (2.0%, a difference of 0.080%), Lithuanian (2.0%, a difference of 0.090%), Assyrian/Chaldean/Syriac (2.0%, a difference of 0.38%), and Immigrants from Eastern Europe (2.0%, a difference of 0.56%). Similarly, the demographic groups most similar to Immigrants from Greece are Maltese (2.0%, a difference of 0.070%), Armenian (2.0%, a difference of 0.13%), Immigrants from Argentina (2.0%, a difference of 0.13%), Immigrants from Northern Africa (2.0%, a difference of 0.24%), and Immigrants from Czechoslovakia (2.0%, a difference of 0.34%).
| Demographics | Rating | Rank | Vision Disability |
| Armenians | 99.0 /100 | #63 | Exceptional 2.0% |
| Immigrants | Greece | 99.0 /100 | #64 | Exceptional 2.0% |
| Maltese | 98.9 /100 | #65 | Exceptional 2.0% |
| Immigrants | Argentina | 98.9 /100 | #66 | Exceptional 2.0% |
| Immigrants | Northern Africa | 98.8 /100 | #67 | Exceptional 2.0% |
| Immigrants | Czechoslovakia | 98.7 /100 | #68 | Exceptional 2.0% |
| Russians | 98.6 /100 | #69 | Exceptional 2.0% |
| Immigrants | Kazakhstan | 98.6 /100 | #70 | Exceptional 2.0% |
| Immigrants | Northern Europe | 98.6 /100 | #71 | Exceptional 2.0% |
| Immigrants | France | 98.5 /100 | #72 | Exceptional 2.0% |
| Immigrants | Eritrea | 98.4 /100 | #73 | Exceptional 2.0% |
| Palestinians | 98.3 /100 | #74 | Exceptional 2.0% |
| Immigrants | North Macedonia | 98.3 /100 | #75 | Exceptional 2.0% |
| Paraguayans | 98.3 /100 | #76 | Exceptional 2.0% |
| Immigrants | Jordan | 98.3 /100 | #77 | Exceptional 2.0% |
| Immigrants | Eastern Europe | 98.3 /100 | #78 | Exceptional 2.0% |
| Assyrians/Chaldeans/Syriacs | 98.1 /100 | #79 | Exceptional 2.0% |
| Lithuanians | 97.7 /100 | #80 | Exceptional 2.0% |
| Soviet Union | 97.6 /100 | #81 | Exceptional 2.0% |
| Immigrants | Poland | 97.6 /100 | #82 | Exceptional 2.0% |
| Immigrants | Western Asia | 97.5 /100 | #83 | Exceptional 2.0% |