Immigrants from Poland vs Immigrants from Brazil Disability Age Over 75
COMPARE
Immigrants from Poland
Immigrants from Brazil
Disability Age Over 75
Disability Age Over 75 Comparison
Immigrants from Poland
Immigrants from Brazil
45.4%
DISABILITY AGE OVER 75
99.9/ 100
METRIC RATING
27th/ 347
METRIC RANK
46.3%
DISABILITY AGE OVER 75
98.0/ 100
METRIC RATING
95th/ 347
METRIC RANK
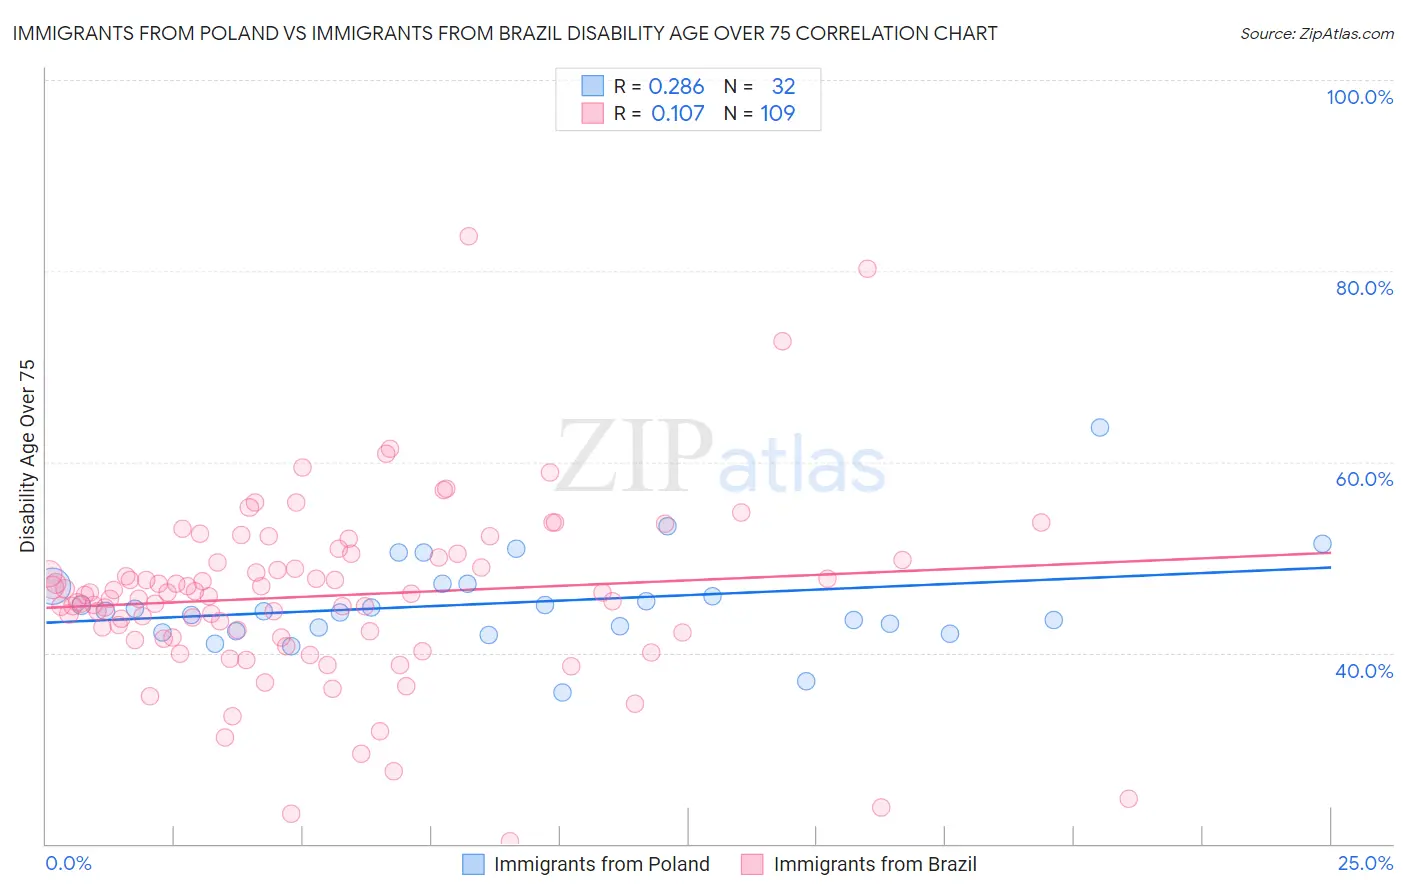
Immigrants from Poland vs Immigrants from Brazil Disability Age Over 75 Correlation Chart
The statistical analysis conducted on geographies consisting of 304,637,447 people shows a weak positive correlation between the proportion of Immigrants from Poland and percentage of population with a disability over the age of 75 in the United States with a correlation coefficient (R) of 0.286 and weighted average of 45.4%. Similarly, the statistical analysis conducted on geographies consisting of 342,544,403 people shows a poor positive correlation between the proportion of Immigrants from Brazil and percentage of population with a disability over the age of 75 in the United States with a correlation coefficient (R) of 0.107 and weighted average of 46.3%, a difference of 2.0%.
Disability Age Over 75 Correlation Summary
| Measurement | Immigrants from Poland | Immigrants from Brazil |
| Minimum | 35.9% | 20.2% |
| Maximum | 63.6% | 83.7% |
| Range | 27.7% | 63.4% |
| Mean | 45.2% | 46.0% |
| Median | 44.4% | 46.1% |
| Interquartile 25% (IQ1) | 42.5% | 41.7% |
| Interquartile 75% (IQ3) | 47.1% | 49.8% |
| Interquartile Range (IQR) | 4.6% | 8.2% |
| Standard Deviation (Sample) | 5.1% | 9.5% |
| Standard Deviation (Population) | 5.0% | 9.5% |
Similar Demographics by Disability Age Over 75
Demographics Similar to Immigrants from Poland by Disability Age Over 75
In terms of disability age over 75, the demographic groups most similar to Immigrants from Poland are Macedonian (45.4%, a difference of 0.010%), Thai (45.4%, a difference of 0.020%), Immigrants from Bolivia (45.4%, a difference of 0.050%), Filipino (45.4%, a difference of 0.060%), and Polish (45.3%, a difference of 0.090%).
| Demographics | Rating | Rank | Disability Age Over 75 |
| Immigrants | Serbia | 100.0 /100 | #20 | Exceptional 45.3% |
| Immigrants | Belgium | 100.0 /100 | #21 | Exceptional 45.3% |
| Immigrants | South Africa | 100.0 /100 | #22 | Exceptional 45.3% |
| Immigrants | Switzerland | 99.9 /100 | #23 | Exceptional 45.3% |
| Poles | 99.9 /100 | #24 | Exceptional 45.3% |
| Immigrants | Bolivia | 99.9 /100 | #25 | Exceptional 45.4% |
| Macedonians | 99.9 /100 | #26 | Exceptional 45.4% |
| Immigrants | Poland | 99.9 /100 | #27 | Exceptional 45.4% |
| Thais | 99.9 /100 | #28 | Exceptional 45.4% |
| Filipinos | 99.9 /100 | #29 | Exceptional 45.4% |
| Immigrants | Denmark | 99.9 /100 | #30 | Exceptional 45.4% |
| Immigrants | Bulgaria | 99.9 /100 | #31 | Exceptional 45.5% |
| Immigrants | Australia | 99.9 /100 | #32 | Exceptional 45.5% |
| Immigrants | Croatia | 99.9 /100 | #33 | Exceptional 45.5% |
| Russians | 99.9 /100 | #34 | Exceptional 45.5% |
Demographics Similar to Immigrants from Brazil by Disability Age Over 75
In terms of disability age over 75, the demographic groups most similar to Immigrants from Brazil are Immigrants from China (46.3%, a difference of 0.010%), Albanian (46.3%, a difference of 0.030%), Finnish (46.3%, a difference of 0.030%), Immigrants from Japan (46.3%, a difference of 0.040%), and German (46.3%, a difference of 0.060%).
| Demographics | Rating | Rank | Disability Age Over 75 |
| Uruguayans | 98.4 /100 | #88 | Exceptional 46.2% |
| Immigrants | Saudi Arabia | 98.4 /100 | #89 | Exceptional 46.3% |
| Northern Europeans | 98.3 /100 | #90 | Exceptional 46.3% |
| Immigrants | Egypt | 98.3 /100 | #91 | Exceptional 46.3% |
| Germans | 98.2 /100 | #92 | Exceptional 46.3% |
| Ugandans | 98.2 /100 | #93 | Exceptional 46.3% |
| Albanians | 98.1 /100 | #94 | Exceptional 46.3% |
| Immigrants | Brazil | 98.0 /100 | #95 | Exceptional 46.3% |
| Immigrants | China | 98.0 /100 | #96 | Exceptional 46.3% |
| Finns | 97.9 /100 | #97 | Exceptional 46.3% |
| Immigrants | Japan | 97.8 /100 | #98 | Exceptional 46.3% |
| Palestinians | 97.7 /100 | #99 | Exceptional 46.3% |
| Immigrants | Eastern Europe | 97.7 /100 | #100 | Exceptional 46.3% |
| Mongolians | 97.7 /100 | #101 | Exceptional 46.3% |
| Immigrants | Malaysia | 97.1 /100 | #102 | Exceptional 46.4% |