Immigrants from Poland vs Estonian Cognitive Disability
COMPARE
Immigrants from Poland
Estonian
Cognitive Disability
Cognitive Disability Comparison
Immigrants from Poland
Estonians
16.1%
COGNITIVE DISABILITY
100.0/ 100
METRIC RATING
8th/ 347
METRIC RANK
16.7%
COGNITIVE DISABILITY
99.3/ 100
METRIC RATING
75th/ 347
METRIC RANK
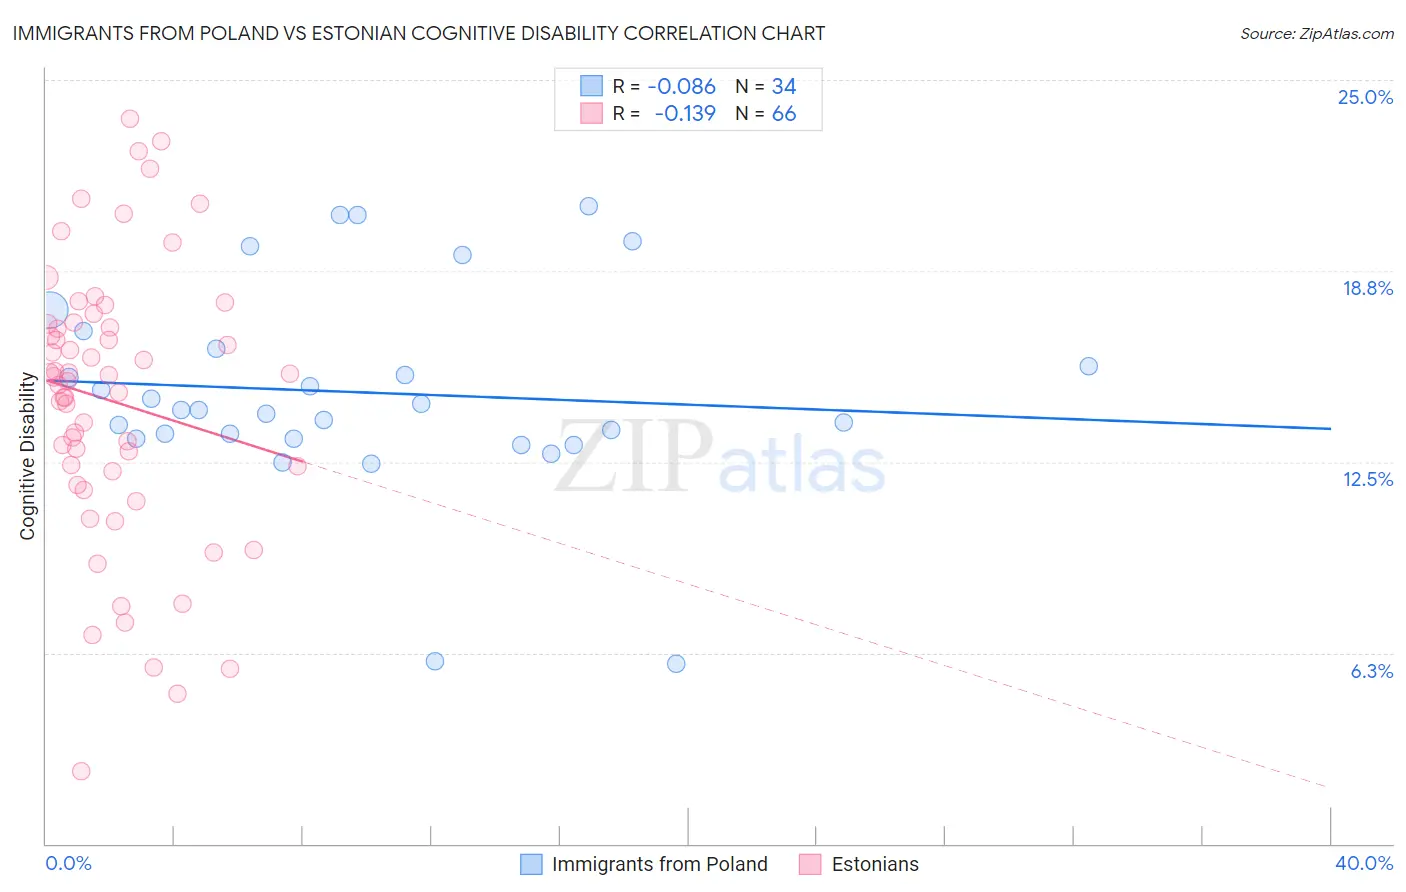
Immigrants from Poland vs Estonian Cognitive Disability Correlation Chart
The statistical analysis conducted on geographies consisting of 304,838,376 people shows a slight negative correlation between the proportion of Immigrants from Poland and percentage of population with cognitive disability in the United States with a correlation coefficient (R) of -0.086 and weighted average of 16.1%. Similarly, the statistical analysis conducted on geographies consisting of 123,512,744 people shows a poor negative correlation between the proportion of Estonians and percentage of population with cognitive disability in the United States with a correlation coefficient (R) of -0.139 and weighted average of 16.7%, a difference of 3.3%.
Cognitive Disability Correlation Summary
| Measurement | Immigrants from Poland | Estonian |
| Minimum | 5.9% | 2.4% |
| Maximum | 20.9% | 23.7% |
| Range | 15.0% | 21.3% |
| Mean | 14.8% | 14.5% |
| Median | 14.2% | 15.2% |
| Interquartile 25% (IQ1) | 13.3% | 12.2% |
| Interquartile 75% (IQ3) | 16.2% | 17.0% |
| Interquartile Range (IQR) | 2.9% | 4.8% |
| Standard Deviation (Sample) | 3.4% | 4.5% |
| Standard Deviation (Population) | 3.3% | 4.5% |
Similar Demographics by Cognitive Disability
Demographics Similar to Immigrants from Poland by Cognitive Disability
In terms of cognitive disability, the demographic groups most similar to Immigrants from Poland are Immigrants from Ireland (16.1%, a difference of 0.020%), Thai (16.1%, a difference of 0.13%), Assyrian/Chaldean/Syriac (16.2%, a difference of 0.32%), Immigrants from Scotland (16.2%, a difference of 0.36%), and Immigrants from Czechoslovakia (16.2%, a difference of 0.45%).
| Demographics | Rating | Rank | Cognitive Disability |
| Immigrants | Taiwan | 100.0 /100 | #1 | Exceptional 15.7% |
| Immigrants | India | 100.0 /100 | #2 | Exceptional 15.9% |
| Chinese | 100.0 /100 | #3 | Exceptional 15.9% |
| Immigrants | Lithuania | 100.0 /100 | #4 | Exceptional 16.0% |
| Immigrants | Hong Kong | 100.0 /100 | #5 | Exceptional 16.0% |
| Thais | 100.0 /100 | #6 | Exceptional 16.1% |
| Immigrants | Ireland | 100.0 /100 | #7 | Exceptional 16.1% |
| Immigrants | Poland | 100.0 /100 | #8 | Exceptional 16.1% |
| Assyrians/Chaldeans/Syriacs | 100.0 /100 | #9 | Exceptional 16.2% |
| Immigrants | Scotland | 100.0 /100 | #10 | Exceptional 16.2% |
| Immigrants | Czechoslovakia | 100.0 /100 | #11 | Exceptional 16.2% |
| Maltese | 100.0 /100 | #12 | Exceptional 16.2% |
| Lithuanians | 100.0 /100 | #13 | Exceptional 16.3% |
| Immigrants | Austria | 100.0 /100 | #14 | Exceptional 16.3% |
| Immigrants | Greece | 100.0 /100 | #15 | Exceptional 16.3% |
Demographics Similar to Estonians by Cognitive Disability
In terms of cognitive disability, the demographic groups most similar to Estonians are Burmese (16.7%, a difference of 0.010%), Slavic (16.7%, a difference of 0.010%), German (16.7%, a difference of 0.020%), Immigrants from Serbia (16.7%, a difference of 0.020%), and Immigrants from Belgium (16.7%, a difference of 0.030%).
| Demographics | Rating | Rank | Cognitive Disability |
| Ukrainians | 99.4 /100 | #68 | Exceptional 16.6% |
| Immigrants | Uzbekistan | 99.4 /100 | #69 | Exceptional 16.7% |
| Immigrants | Sweden | 99.4 /100 | #70 | Exceptional 16.7% |
| Immigrants | Belgium | 99.3 /100 | #71 | Exceptional 16.7% |
| Germans | 99.3 /100 | #72 | Exceptional 16.7% |
| Burmese | 99.3 /100 | #73 | Exceptional 16.7% |
| Slavs | 99.3 /100 | #74 | Exceptional 16.7% |
| Estonians | 99.3 /100 | #75 | Exceptional 16.7% |
| Immigrants | Serbia | 99.3 /100 | #76 | Exceptional 16.7% |
| Immigrants | Hungary | 99.3 /100 | #77 | Exceptional 16.7% |
| Peruvians | 99.3 /100 | #78 | Exceptional 16.7% |
| Immigrants | Bulgaria | 99.3 /100 | #79 | Exceptional 16.7% |
| Egyptians | 99.2 /100 | #80 | Exceptional 16.7% |
| Immigrants | Netherlands | 99.2 /100 | #81 | Exceptional 16.7% |
| Swiss | 99.2 /100 | #82 | Exceptional 16.7% |