Immigrants from Philippines vs Burmese Disability Age 35 to 64
COMPARE
Immigrants from Philippines
Burmese
Disability Age 35 to 64
Disability Age 35 to 64 Comparison
Immigrants from Philippines
Burmese
10.4%
DISABILITY AGE 35 TO 64
98.0/ 100
METRIC RATING
101st/ 347
METRIC RANK
9.2%
DISABILITY AGE 35 TO 64
100.0/ 100
METRIC RATING
17th/ 347
METRIC RANK
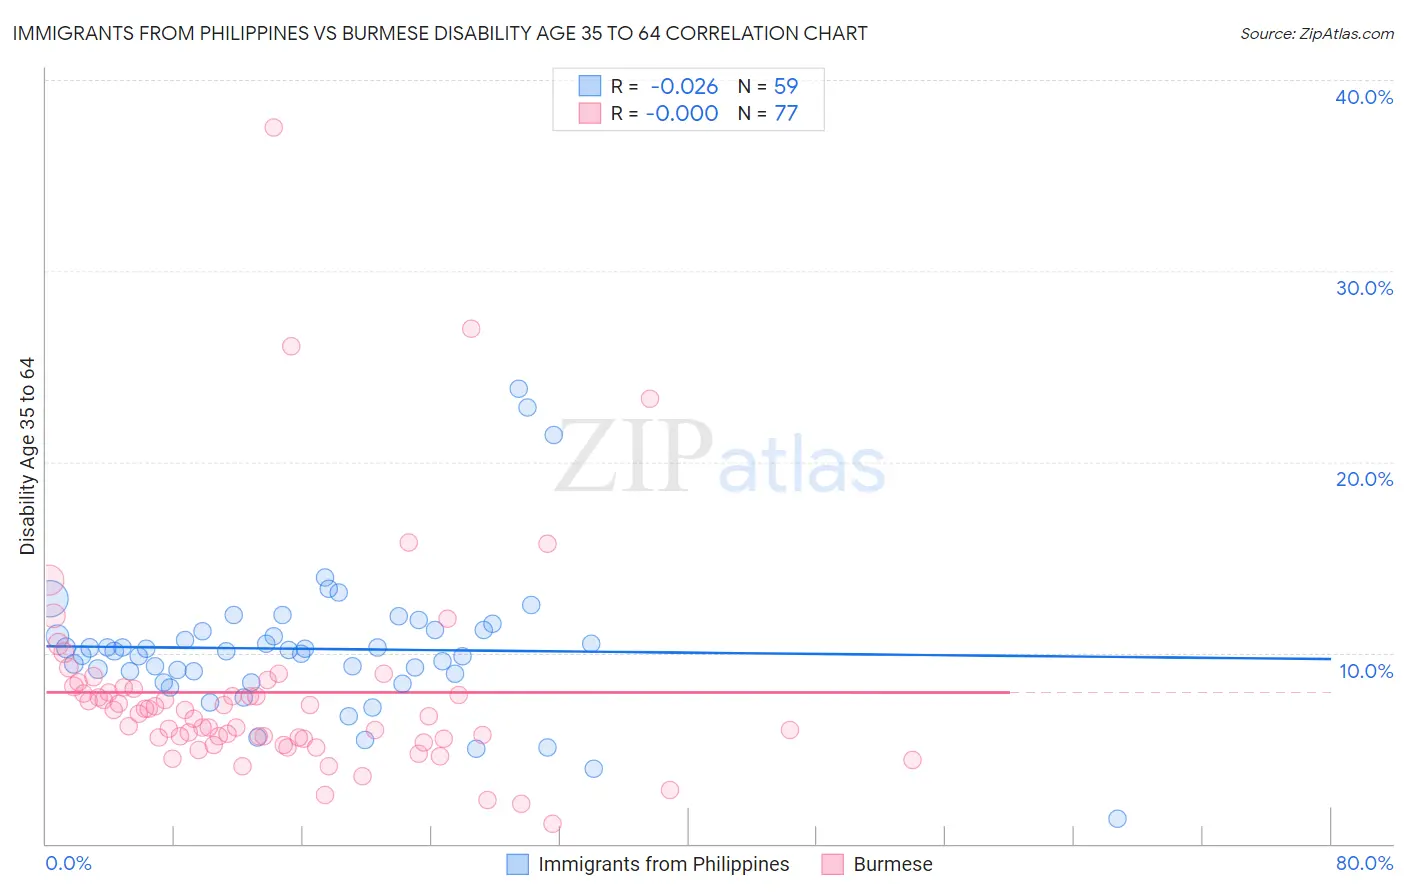
Immigrants from Philippines vs Burmese Disability Age 35 to 64 Correlation Chart
The statistical analysis conducted on geographies consisting of 470,924,996 people shows no correlation between the proportion of Immigrants from Philippines and percentage of population with a disability between the ages 34 and 64 in the United States with a correlation coefficient (R) of -0.026 and weighted average of 10.4%. Similarly, the statistical analysis conducted on geographies consisting of 464,803,120 people shows no correlation between the proportion of Burmese and percentage of population with a disability between the ages 34 and 64 in the United States with a correlation coefficient (R) of -0.000 and weighted average of 9.2%, a difference of 12.8%.
Disability Age 35 to 64 Correlation Summary
| Measurement | Immigrants from Philippines | Burmese |
| Minimum | 1.3% | 1.0% |
| Maximum | 23.8% | 37.5% |
| Range | 22.5% | 36.5% |
| Mean | 10.2% | 7.9% |
| Median | 10.1% | 6.8% |
| Interquartile 25% (IQ1) | 8.9% | 5.5% |
| Interquartile 75% (IQ3) | 11.2% | 8.2% |
| Interquartile Range (IQR) | 2.3% | 2.6% |
| Standard Deviation (Sample) | 3.7% | 5.6% |
| Standard Deviation (Population) | 3.7% | 5.6% |
Similar Demographics by Disability Age 35 to 64
Demographics Similar to Immigrants from Philippines by Disability Age 35 to 64
In terms of disability age 35 to 64, the demographic groups most similar to Immigrants from Philippines are Immigrants from Jordan (10.4%, a difference of 0.050%), Immigrants from Western Asia (10.4%, a difference of 0.070%), Immigrants from Ukraine (10.4%, a difference of 0.090%), Immigrants from Austria (10.4%, a difference of 0.23%), and Macedonian (10.4%, a difference of 0.26%).
| Demographics | Rating | Rank | Disability Age 35 to 64 |
| Immigrants | Italy | 98.7 /100 | #94 | Exceptional 10.3% |
| Chinese | 98.7 /100 | #95 | Exceptional 10.3% |
| Immigrants | South Africa | 98.5 /100 | #96 | Exceptional 10.3% |
| Immigrants | Denmark | 98.4 /100 | #97 | Exceptional 10.3% |
| Immigrants | Uruguay | 98.3 /100 | #98 | Exceptional 10.3% |
| Palestinians | 98.2 /100 | #99 | Exceptional 10.4% |
| Immigrants | Jordan | 98.1 /100 | #100 | Exceptional 10.4% |
| Immigrants | Philippines | 98.0 /100 | #101 | Exceptional 10.4% |
| Immigrants | Western Asia | 98.0 /100 | #102 | Exceptional 10.4% |
| Immigrants | Ukraine | 97.9 /100 | #103 | Exceptional 10.4% |
| Immigrants | Austria | 97.8 /100 | #104 | Exceptional 10.4% |
| Macedonians | 97.8 /100 | #105 | Exceptional 10.4% |
| Immigrants | Hungary | 97.6 /100 | #106 | Exceptional 10.4% |
| Zimbabweans | 97.4 /100 | #107 | Exceptional 10.4% |
| Ethiopians | 97.4 /100 | #108 | Exceptional 10.5% |
Demographics Similar to Burmese by Disability Age 35 to 64
In terms of disability age 35 to 64, the demographic groups most similar to Burmese are Soviet Union (9.2%, a difference of 0.41%), Immigrants from Venezuela (9.3%, a difference of 0.65%), Immigrants from Argentina (9.3%, a difference of 1.2%), Okinawan (9.4%, a difference of 1.6%), and Cypriot (9.4%, a difference of 1.6%).
| Demographics | Rating | Rank | Disability Age 35 to 64 |
| Immigrants | Bolivia | 100.0 /100 | #10 | Exceptional 8.7% |
| Immigrants | Eastern Asia | 100.0 /100 | #11 | Exceptional 8.8% |
| Indians (Asian) | 100.0 /100 | #12 | Exceptional 8.9% |
| Immigrants | South Central Asia | 100.0 /100 | #13 | Exceptional 8.9% |
| Immigrants | Singapore | 100.0 /100 | #14 | Exceptional 8.9% |
| Bolivians | 100.0 /100 | #15 | Exceptional 8.9% |
| Immigrants | Korea | 100.0 /100 | #16 | Exceptional 9.0% |
| Burmese | 100.0 /100 | #17 | Exceptional 9.2% |
| Soviet Union | 100.0 /100 | #18 | Exceptional 9.2% |
| Immigrants | Venezuela | 100.0 /100 | #19 | Exceptional 9.3% |
| Immigrants | Argentina | 100.0 /100 | #20 | Exceptional 9.3% |
| Okinawans | 100.0 /100 | #21 | Exceptional 9.4% |
| Cypriots | 100.0 /100 | #22 | Exceptional 9.4% |
| Argentineans | 100.0 /100 | #23 | Exceptional 9.4% |
| Asians | 100.0 /100 | #24 | Exceptional 9.4% |