Immigrants from Peru vs Immigrants from Senegal Cognitive Disability
COMPARE
Immigrants from Peru
Immigrants from Senegal
Cognitive Disability
Cognitive Disability Comparison
Immigrants from Peru
Immigrants from Senegal
16.6%
COGNITIVE DISABILITY
99.7/ 100
METRIC RATING
59th/ 347
METRIC RANK
18.7%
COGNITIVE DISABILITY
0.0/ 100
METRIC RATING
326th/ 347
METRIC RANK
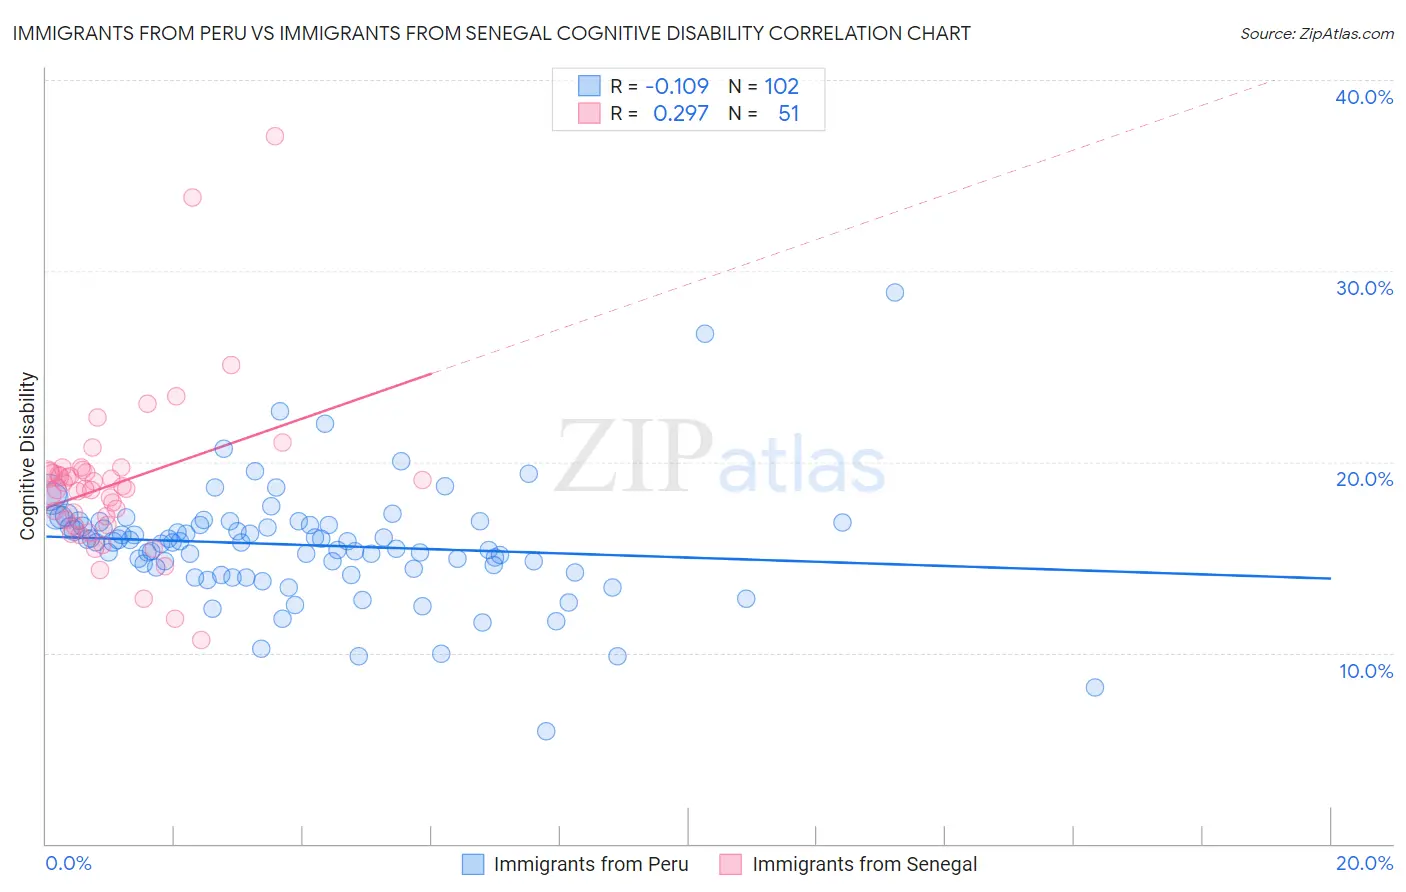
Immigrants from Peru vs Immigrants from Senegal Cognitive Disability Correlation Chart
The statistical analysis conducted on geographies consisting of 328,830,474 people shows a poor negative correlation between the proportion of Immigrants from Peru and percentage of population with cognitive disability in the United States with a correlation coefficient (R) of -0.109 and weighted average of 16.6%. Similarly, the statistical analysis conducted on geographies consisting of 90,129,295 people shows a weak positive correlation between the proportion of Immigrants from Senegal and percentage of population with cognitive disability in the United States with a correlation coefficient (R) of 0.297 and weighted average of 18.7%, a difference of 12.8%.
Cognitive Disability Correlation Summary
| Measurement | Immigrants from Peru | Immigrants from Senegal |
| Minimum | 5.9% | 10.7% |
| Maximum | 28.9% | 37.0% |
| Range | 23.0% | 26.4% |
| Mean | 15.7% | 18.8% |
| Median | 15.8% | 18.6% |
| Interquartile 25% (IQ1) | 14.4% | 16.7% |
| Interquartile 75% (IQ3) | 16.8% | 19.5% |
| Interquartile Range (IQR) | 2.4% | 2.8% |
| Standard Deviation (Sample) | 3.1% | 4.3% |
| Standard Deviation (Population) | 3.1% | 4.3% |
Similar Demographics by Cognitive Disability
Demographics Similar to Immigrants from Peru by Cognitive Disability
In terms of cognitive disability, the demographic groups most similar to Immigrants from Peru are Pennsylvania German (16.6%, a difference of 0.0%), Romanian (16.6%, a difference of 0.010%), Immigrants from England (16.6%, a difference of 0.070%), Austrian (16.6%, a difference of 0.080%), and Bhutanese (16.6%, a difference of 0.080%).
| Demographics | Rating | Rank | Cognitive Disability |
| Soviet Union | 99.8 /100 | #52 | Exceptional 16.5% |
| Swedes | 99.8 /100 | #53 | Exceptional 16.5% |
| Immigrants | Iran | 99.8 /100 | #54 | Exceptional 16.5% |
| Immigrants | Venezuela | 99.7 /100 | #55 | Exceptional 16.5% |
| Austrians | 99.7 /100 | #56 | Exceptional 16.6% |
| Bhutanese | 99.7 /100 | #57 | Exceptional 16.6% |
| Pennsylvania Germans | 99.7 /100 | #58 | Exceptional 16.6% |
| Immigrants | Peru | 99.7 /100 | #59 | Exceptional 16.6% |
| Romanians | 99.7 /100 | #60 | Exceptional 16.6% |
| Immigrants | England | 99.6 /100 | #61 | Exceptional 16.6% |
| Czechoslovakians | 99.6 /100 | #62 | Exceptional 16.6% |
| Argentineans | 99.6 /100 | #63 | Exceptional 16.6% |
| Venezuelans | 99.6 /100 | #64 | Exceptional 16.6% |
| Colombians | 99.6 /100 | #65 | Exceptional 16.6% |
| Immigrants | Ukraine | 99.5 /100 | #66 | Exceptional 16.6% |
Demographics Similar to Immigrants from Senegal by Cognitive Disability
In terms of cognitive disability, the demographic groups most similar to Immigrants from Senegal are Indonesian (18.7%, a difference of 0.020%), U.S. Virgin Islander (18.7%, a difference of 0.040%), Dominican (18.7%, a difference of 0.10%), Kiowa (18.7%, a difference of 0.10%), and Pueblo (18.7%, a difference of 0.22%).
| Demographics | Rating | Rank | Cognitive Disability |
| Comanche | 0.0 /100 | #319 | Tragic 18.6% |
| Apache | 0.0 /100 | #320 | Tragic 18.6% |
| Africans | 0.0 /100 | #321 | Tragic 18.6% |
| Immigrants | Liberia | 0.0 /100 | #322 | Tragic 18.7% |
| Pueblo | 0.0 /100 | #323 | Tragic 18.7% |
| Dominicans | 0.0 /100 | #324 | Tragic 18.7% |
| Indonesians | 0.0 /100 | #325 | Tragic 18.7% |
| Immigrants | Senegal | 0.0 /100 | #326 | Tragic 18.7% |
| U.S. Virgin Islanders | 0.0 /100 | #327 | Tragic 18.7% |
| Kiowa | 0.0 /100 | #328 | Tragic 18.7% |
| Navajo | 0.0 /100 | #329 | Tragic 18.8% |
| Immigrants | Dominican Republic | 0.0 /100 | #330 | Tragic 18.8% |
| Pima | 0.0 /100 | #331 | Tragic 18.8% |
| Immigrants | Sudan | 0.0 /100 | #332 | Tragic 18.8% |
| Immigrants | Yemen | 0.0 /100 | #333 | Tragic 18.8% |