Immigrants from Peru vs Immigrants from Latvia Disability Age 35 to 64
COMPARE
Immigrants from Peru
Immigrants from Latvia
Disability Age 35 to 64
Disability Age 35 to 64 Comparison
Immigrants from Peru
Immigrants from Latvia
9.8%
DISABILITY AGE 35 TO 64
99.9/ 100
METRIC RATING
45th/ 347
METRIC RANK
10.1%
DISABILITY AGE 35 TO 64
99.4/ 100
METRIC RATING
75th/ 347
METRIC RANK
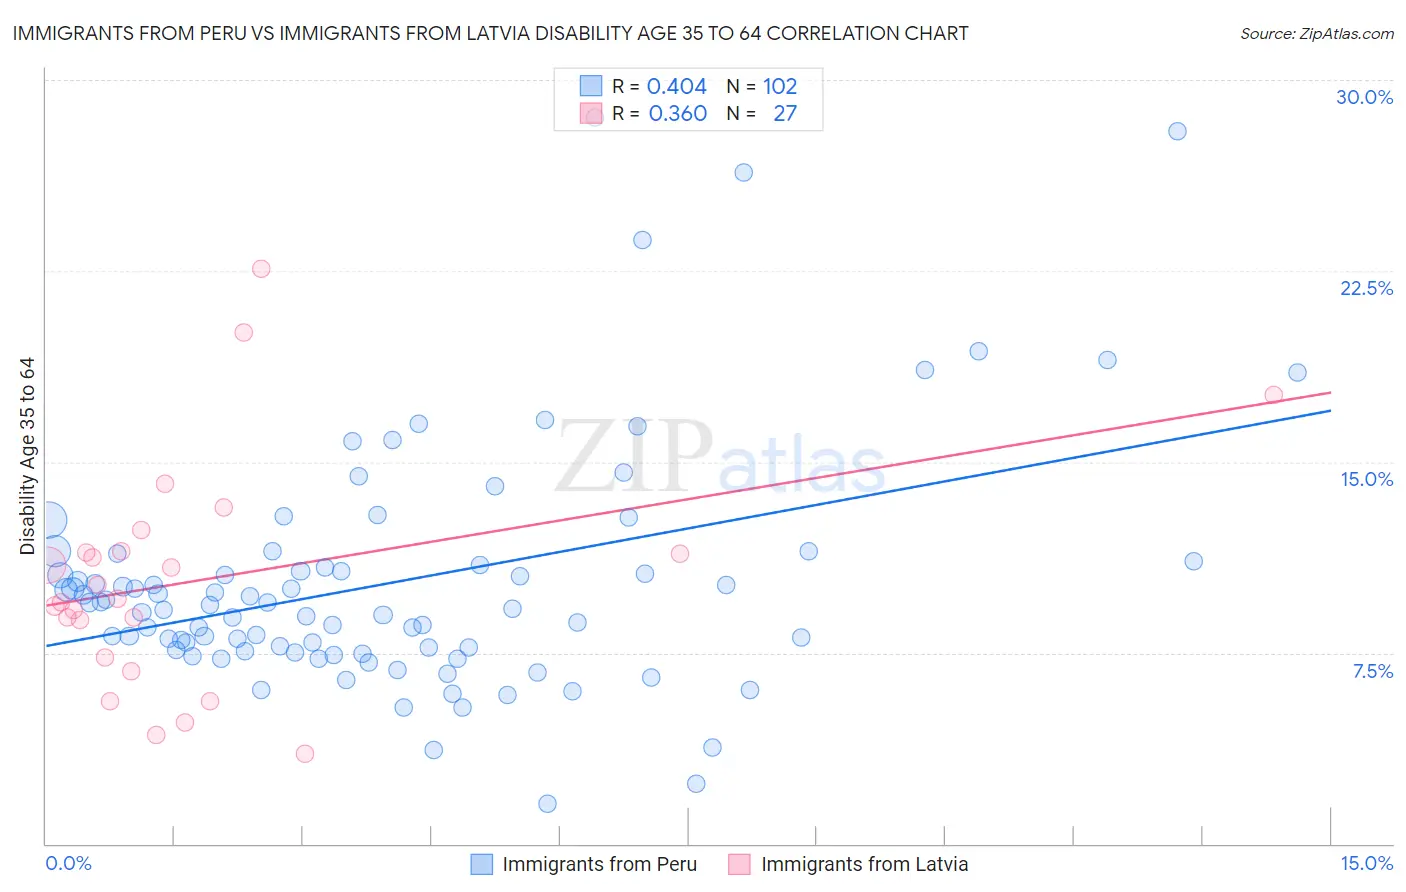
Immigrants from Peru vs Immigrants from Latvia Disability Age 35 to 64 Correlation Chart
The statistical analysis conducted on geographies consisting of 328,733,403 people shows a moderate positive correlation between the proportion of Immigrants from Peru and percentage of population with a disability between the ages 34 and 64 in the United States with a correlation coefficient (R) of 0.404 and weighted average of 9.8%. Similarly, the statistical analysis conducted on geographies consisting of 113,723,029 people shows a mild positive correlation between the proportion of Immigrants from Latvia and percentage of population with a disability between the ages 34 and 64 in the United States with a correlation coefficient (R) of 0.360 and weighted average of 10.1%, a difference of 3.3%.
Disability Age 35 to 64 Correlation Summary
| Measurement | Immigrants from Peru | Immigrants from Latvia |
| Minimum | 1.6% | 3.5% |
| Maximum | 28.5% | 22.6% |
| Range | 27.0% | 19.1% |
| Mean | 10.3% | 10.4% |
| Median | 9.3% | 9.6% |
| Interquartile 25% (IQ1) | 7.6% | 7.3% |
| Interquartile 75% (IQ3) | 11.0% | 11.5% |
| Interquartile Range (IQR) | 3.4% | 4.2% |
| Standard Deviation (Sample) | 4.7% | 4.5% |
| Standard Deviation (Population) | 4.7% | 4.4% |
Similar Demographics by Disability Age 35 to 64
Demographics Similar to Immigrants from Peru by Disability Age 35 to 64
In terms of disability age 35 to 64, the demographic groups most similar to Immigrants from Peru are Immigrants from Egypt (9.8%, a difference of 0.060%), Cambodian (9.8%, a difference of 0.18%), Immigrants from Belgium (9.8%, a difference of 0.24%), Immigrants from Serbia (9.8%, a difference of 0.25%), and Immigrants from Greece (9.8%, a difference of 0.29%).
| Demographics | Rating | Rank | Disability Age 35 to 64 |
| Egyptians | 99.9 /100 | #38 | Exceptional 9.7% |
| Immigrants | Belarus | 99.9 /100 | #39 | Exceptional 9.7% |
| Immigrants | Armenia | 99.9 /100 | #40 | Exceptional 9.7% |
| Israelis | 99.9 /100 | #41 | Exceptional 9.7% |
| Immigrants | Malaysia | 99.9 /100 | #42 | Exceptional 9.7% |
| Immigrants | Colombia | 99.9 /100 | #43 | Exceptional 9.8% |
| Immigrants | Egypt | 99.9 /100 | #44 | Exceptional 9.8% |
| Immigrants | Peru | 99.9 /100 | #45 | Exceptional 9.8% |
| Cambodians | 99.8 /100 | #46 | Exceptional 9.8% |
| Immigrants | Belgium | 99.8 /100 | #47 | Exceptional 9.8% |
| Immigrants | Serbia | 99.8 /100 | #48 | Exceptional 9.8% |
| Immigrants | Greece | 99.8 /100 | #49 | Exceptional 9.8% |
| Paraguayans | 99.8 /100 | #50 | Exceptional 9.8% |
| Bhutanese | 99.8 /100 | #51 | Exceptional 9.8% |
| Immigrants | Bulgaria | 99.8 /100 | #52 | Exceptional 9.8% |
Demographics Similar to Immigrants from Latvia by Disability Age 35 to 64
In terms of disability age 35 to 64, the demographic groups most similar to Immigrants from Latvia are Immigrants from Chile (10.1%, a difference of 0.010%), Mongolian (10.1%, a difference of 0.040%), Laotian (10.1%, a difference of 0.090%), Jordanian (10.1%, a difference of 0.18%), and Immigrants from Vietnam (10.1%, a difference of 0.26%).
| Demographics | Rating | Rank | Disability Age 35 to 64 |
| Immigrants | Switzerland | 99.5 /100 | #68 | Exceptional 10.1% |
| Immigrants | Eastern Europe | 99.5 /100 | #69 | Exceptional 10.1% |
| Immigrants | Nicaragua | 99.5 /100 | #70 | Exceptional 10.1% |
| Immigrants | Kazakhstan | 99.5 /100 | #71 | Exceptional 10.1% |
| Immigrants | Northern Europe | 99.5 /100 | #72 | Exceptional 10.1% |
| Immigrants | France | 99.5 /100 | #73 | Exceptional 10.1% |
| Laotians | 99.4 /100 | #74 | Exceptional 10.1% |
| Immigrants | Latvia | 99.4 /100 | #75 | Exceptional 10.1% |
| Immigrants | Chile | 99.4 /100 | #76 | Exceptional 10.1% |
| Mongolians | 99.4 /100 | #77 | Exceptional 10.1% |
| Jordanians | 99.3 /100 | #78 | Exceptional 10.1% |
| Immigrants | Vietnam | 99.3 /100 | #79 | Exceptional 10.1% |
| Immigrants | Croatia | 99.3 /100 | #80 | Exceptional 10.2% |
| Latvians | 99.2 /100 | #81 | Exceptional 10.2% |
| Russians | 99.2 /100 | #82 | Exceptional 10.2% |