Immigrants from Pakistan vs Immigrants from Poland Disability
COMPARE
Immigrants from Pakistan
Immigrants from Poland
Disability
Disability Comparison
Immigrants from Pakistan
Immigrants from Poland
10.4%
DISABILITY
100.0/ 100
METRIC RATING
19th/ 347
METRIC RANK
11.1%
DISABILITY
99.1/ 100
METRIC RATING
81st/ 347
METRIC RANK
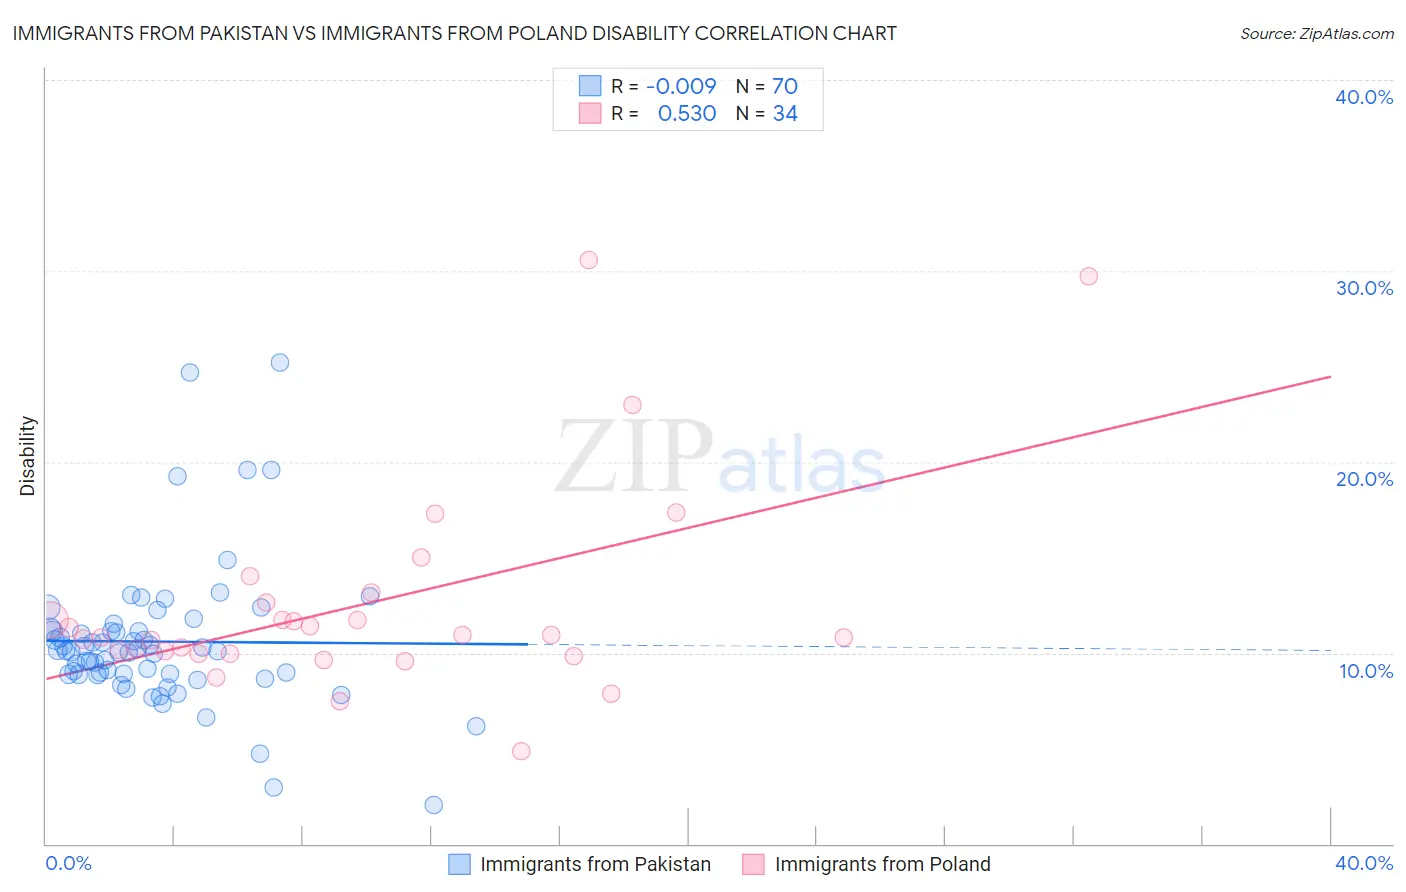
Immigrants from Pakistan vs Immigrants from Poland Disability Correlation Chart
The statistical analysis conducted on geographies consisting of 283,903,019 people shows no correlation between the proportion of Immigrants from Pakistan and percentage of population with a disability in the United States with a correlation coefficient (R) of -0.009 and weighted average of 10.4%. Similarly, the statistical analysis conducted on geographies consisting of 304,838,062 people shows a substantial positive correlation between the proportion of Immigrants from Poland and percentage of population with a disability in the United States with a correlation coefficient (R) of 0.530 and weighted average of 11.1%, a difference of 7.0%.
Disability Correlation Summary
| Measurement | Immigrants from Pakistan | Immigrants from Poland |
| Minimum | 2.0% | 4.8% |
| Maximum | 25.2% | 30.6% |
| Range | 23.2% | 25.7% |
| Mean | 10.6% | 12.5% |
| Median | 10.1% | 10.9% |
| Interquartile 25% (IQ1) | 8.9% | 10.0% |
| Interquartile 75% (IQ3) | 11.2% | 12.6% |
| Interquartile Range (IQR) | 2.3% | 2.7% |
| Standard Deviation (Sample) | 3.8% | 5.5% |
| Standard Deviation (Population) | 3.8% | 5.4% |
Similar Demographics by Disability
Demographics Similar to Immigrants from Pakistan by Disability
In terms of disability, the demographic groups most similar to Immigrants from Pakistan are Burmese (10.4%, a difference of 0.010%), Immigrants from Venezuela (10.4%, a difference of 0.69%), Asian (10.4%, a difference of 0.72%), Immigrants from Sri Lanka (10.5%, a difference of 0.82%), and Immigrants from Iran (10.3%, a difference of 0.99%).
| Demographics | Rating | Rank | Disability |
| Immigrants | Israel | 100.0 /100 | #12 | Exceptional 10.1% |
| Immigrants | Eastern Asia | 100.0 /100 | #13 | Exceptional 10.2% |
| Immigrants | Korea | 100.0 /100 | #14 | Exceptional 10.2% |
| Okinawans | 100.0 /100 | #15 | Exceptional 10.3% |
| Indians (Asian) | 100.0 /100 | #16 | Exceptional 10.3% |
| Immigrants | Iran | 100.0 /100 | #17 | Exceptional 10.3% |
| Burmese | 100.0 /100 | #18 | Exceptional 10.4% |
| Immigrants | Pakistan | 100.0 /100 | #19 | Exceptional 10.4% |
| Immigrants | Venezuela | 100.0 /100 | #20 | Exceptional 10.4% |
| Asians | 100.0 /100 | #21 | Exceptional 10.4% |
| Immigrants | Sri Lanka | 100.0 /100 | #22 | Exceptional 10.5% |
| Immigrants | Asia | 100.0 /100 | #23 | Exceptional 10.5% |
| Venezuelans | 100.0 /100 | #24 | Exceptional 10.5% |
| Immigrants | Malaysia | 100.0 /100 | #25 | Exceptional 10.6% |
| Argentineans | 100.0 /100 | #26 | Exceptional 10.6% |
Demographics Similar to Immigrants from Poland by Disability
In terms of disability, the demographic groups most similar to Immigrants from Poland are Chilean (11.1%, a difference of 0.050%), Immigrants from Switzerland (11.1%, a difference of 0.080%), Immigrants from Sierra Leone (11.1%, a difference of 0.090%), Immigrants from Belarus (11.1%, a difference of 0.24%), and Immigrants from Russia (11.1%, a difference of 0.24%).
| Demographics | Rating | Rank | Disability |
| Immigrants | Serbia | 99.4 /100 | #74 | Exceptional 11.0% |
| Immigrants | Vietnam | 99.4 /100 | #75 | Exceptional 11.0% |
| Sierra Leoneans | 99.3 /100 | #76 | Exceptional 11.0% |
| Immigrants | Belgium | 99.3 /100 | #77 | Exceptional 11.0% |
| Immigrants | Cameroon | 99.3 /100 | #78 | Exceptional 11.1% |
| Immigrants | Jordan | 99.3 /100 | #79 | Exceptional 11.1% |
| Immigrants | Ireland | 99.3 /100 | #80 | Exceptional 11.1% |
| Immigrants | Poland | 99.1 /100 | #81 | Exceptional 11.1% |
| Chileans | 99.1 /100 | #82 | Exceptional 11.1% |
| Immigrants | Switzerland | 99.0 /100 | #83 | Exceptional 11.1% |
| Immigrants | Sierra Leone | 99.0 /100 | #84 | Exceptional 11.1% |
| Immigrants | Belarus | 98.9 /100 | #85 | Exceptional 11.1% |
| Immigrants | Russia | 98.9 /100 | #86 | Exceptional 11.1% |
| Palestinians | 98.9 /100 | #87 | Exceptional 11.1% |
| Immigrants | Romania | 98.5 /100 | #88 | Exceptional 11.2% |