Immigrants from Pakistan vs French Ambulatory Disability
COMPARE
Immigrants from Pakistan
French
Ambulatory Disability
Ambulatory Disability Comparison
Immigrants from Pakistan
French
5.5%
AMBULATORY DISABILITY
100.0/ 100
METRIC RATING
33rd/ 347
METRIC RANK
6.6%
AMBULATORY DISABILITY
0.1/ 100
METRIC RATING
269th/ 347
METRIC RANK
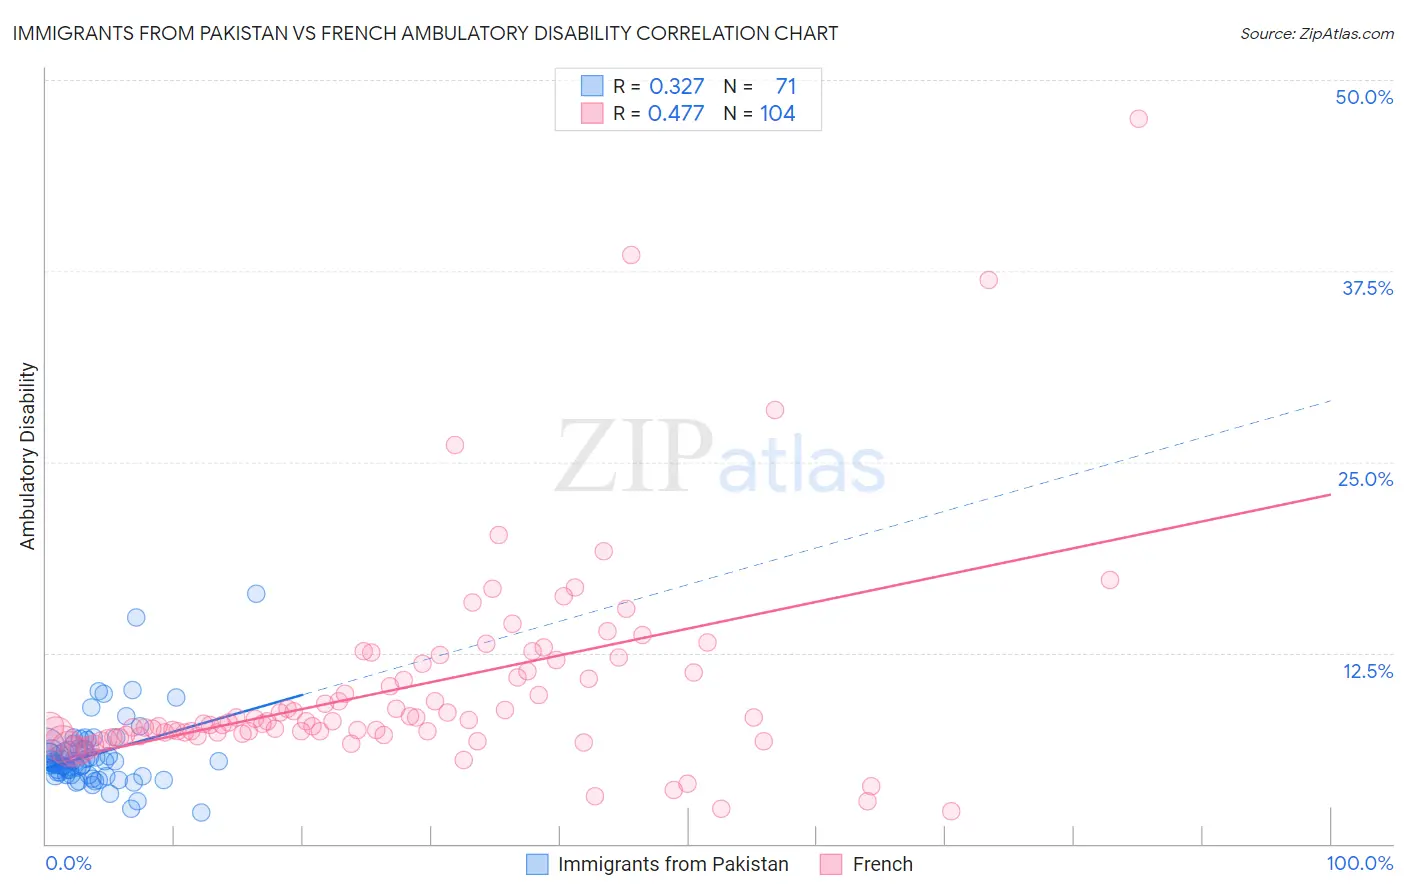
Immigrants from Pakistan vs French Ambulatory Disability Correlation Chart
The statistical analysis conducted on geographies consisting of 283,855,056 people shows a mild positive correlation between the proportion of Immigrants from Pakistan and percentage of population with ambulatory disability in the United States with a correlation coefficient (R) of 0.327 and weighted average of 5.5%. Similarly, the statistical analysis conducted on geographies consisting of 571,874,701 people shows a moderate positive correlation between the proportion of French and percentage of population with ambulatory disability in the United States with a correlation coefficient (R) of 0.477 and weighted average of 6.6%, a difference of 21.7%.
Ambulatory Disability Correlation Summary
| Measurement | Immigrants from Pakistan | French |
| Minimum | 2.0% | 2.1% |
| Maximum | 16.3% | 47.5% |
| Range | 14.3% | 45.4% |
| Mean | 5.8% | 10.2% |
| Median | 5.4% | 8.0% |
| Interquartile 25% (IQ1) | 4.5% | 7.2% |
| Interquartile 75% (IQ3) | 6.2% | 11.6% |
| Interquartile Range (IQR) | 1.7% | 4.4% |
| Standard Deviation (Sample) | 2.3% | 6.9% |
| Standard Deviation (Population) | 2.3% | 6.8% |
Similar Demographics by Ambulatory Disability
Demographics Similar to Immigrants from Pakistan by Ambulatory Disability
In terms of ambulatory disability, the demographic groups most similar to Immigrants from Pakistan are Immigrants from Australia (5.5%, a difference of 0.12%), Immigrants from Asia (5.5%, a difference of 0.16%), Afghan (5.5%, a difference of 0.20%), Immigrants from Malaysia (5.5%, a difference of 0.27%), and Turkish (5.5%, a difference of 0.28%).
| Demographics | Rating | Rank | Ambulatory Disability |
| Immigrants | Nepal | 100.0 /100 | #26 | Exceptional 5.4% |
| Asians | 100.0 /100 | #27 | Exceptional 5.4% |
| Cambodians | 100.0 /100 | #28 | Exceptional 5.4% |
| Immigrants | Iran | 100.0 /100 | #29 | Exceptional 5.4% |
| Immigrants | Turkey | 100.0 /100 | #30 | Exceptional 5.4% |
| Immigrants | Venezuela | 100.0 /100 | #31 | Exceptional 5.4% |
| Immigrants | Australia | 100.0 /100 | #32 | Exceptional 5.5% |
| Immigrants | Pakistan | 100.0 /100 | #33 | Exceptional 5.5% |
| Immigrants | Asia | 100.0 /100 | #34 | Exceptional 5.5% |
| Afghans | 100.0 /100 | #35 | Exceptional 5.5% |
| Immigrants | Malaysia | 100.0 /100 | #36 | Exceptional 5.5% |
| Turks | 100.0 /100 | #37 | Exceptional 5.5% |
| Cypriots | 100.0 /100 | #38 | Exceptional 5.5% |
| Immigrants | Eritrea | 100.0 /100 | #39 | Exceptional 5.5% |
| Venezuelans | 99.9 /100 | #40 | Exceptional 5.5% |
Demographics Similar to French by Ambulatory Disability
In terms of ambulatory disability, the demographic groups most similar to French are Slovak (6.7%, a difference of 0.16%), Immigrants from Trinidad and Tobago (6.7%, a difference of 0.26%), Spanish (6.6%, a difference of 0.31%), Trinidadian and Tobagonian (6.6%, a difference of 0.32%), and Guyanese (6.6%, a difference of 0.45%).
| Demographics | Rating | Rank | Ambulatory Disability |
| English | 0.4 /100 | #262 | Tragic 6.6% |
| Hmong | 0.3 /100 | #263 | Tragic 6.6% |
| Nepalese | 0.2 /100 | #264 | Tragic 6.6% |
| Bahamians | 0.2 /100 | #265 | Tragic 6.6% |
| Guyanese | 0.2 /100 | #266 | Tragic 6.6% |
| Trinidadians and Tobagonians | 0.2 /100 | #267 | Tragic 6.6% |
| Spanish | 0.2 /100 | #268 | Tragic 6.6% |
| French | 0.1 /100 | #269 | Tragic 6.6% |
| Slovaks | 0.1 /100 | #270 | Tragic 6.7% |
| Immigrants | Trinidad and Tobago | 0.1 /100 | #271 | Tragic 6.7% |
| French Canadians | 0.1 /100 | #272 | Tragic 6.7% |
| Whites/Caucasians | 0.1 /100 | #273 | Tragic 6.7% |
| Sioux | 0.1 /100 | #274 | Tragic 6.7% |
| Immigrants | Guyana | 0.1 /100 | #275 | Tragic 6.7% |
| Celtics | 0.1 /100 | #276 | Tragic 6.7% |