Immigrants from Northern Africa vs Okinawan Disability Age 18 to 34
COMPARE
Immigrants from Northern Africa
Okinawan
Disability Age 18 to 34
Disability Age 18 to 34 Comparison
Immigrants from Northern Africa
Okinawans
6.1%
DISABILITY AGE 18 TO 34
98.4/ 100
METRIC RATING
82nd/ 347
METRIC RANK
5.9%
DISABILITY AGE 18 TO 34
99.7/ 100
METRIC RATING
52nd/ 347
METRIC RANK
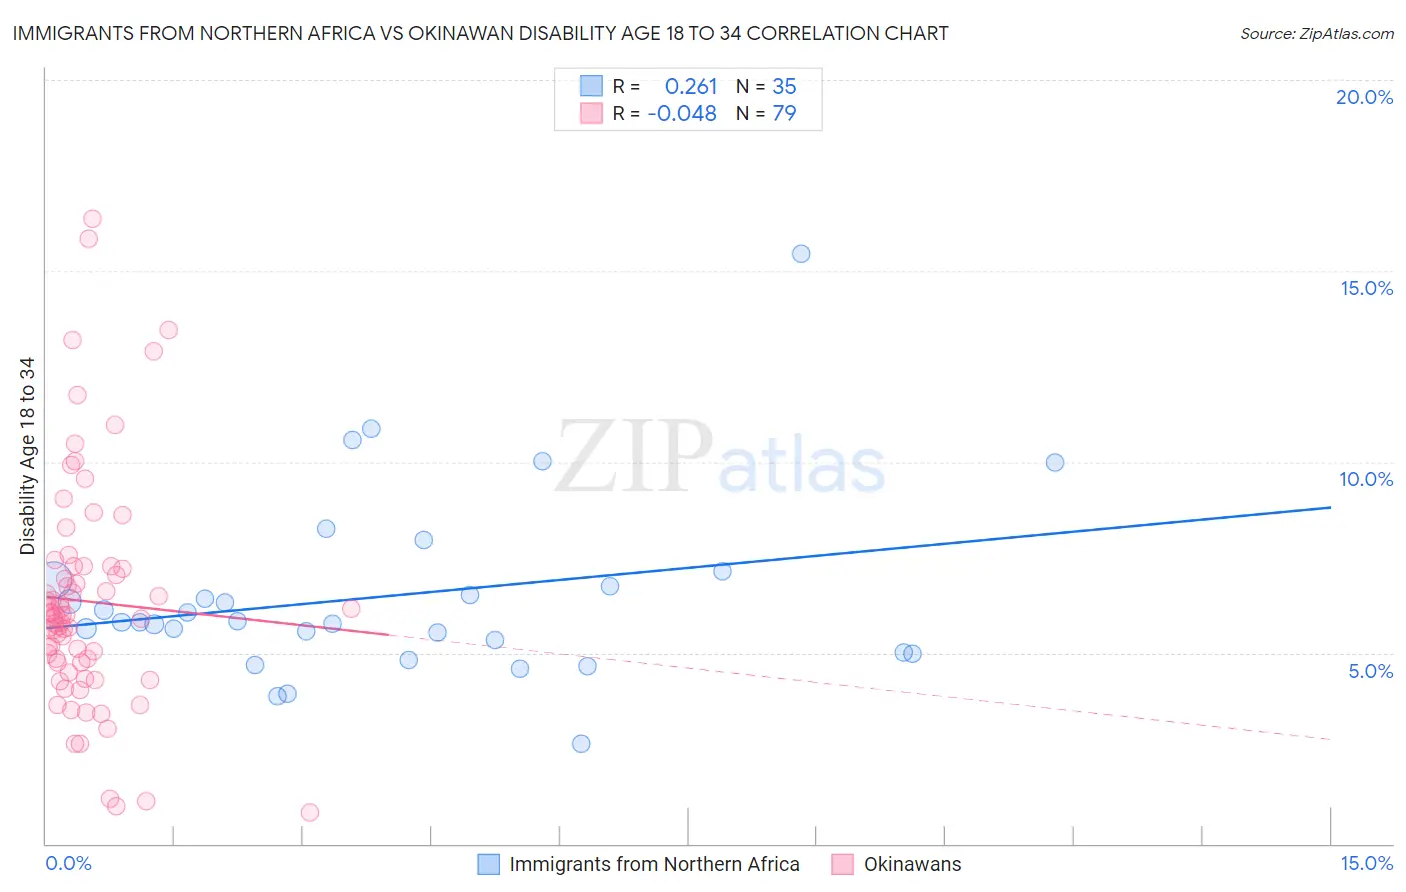
Immigrants from Northern Africa vs Okinawan Disability Age 18 to 34 Correlation Chart
The statistical analysis conducted on geographies consisting of 320,800,058 people shows a weak positive correlation between the proportion of Immigrants from Northern Africa and percentage of population with a disability between the ages 18 and 35 in the United States with a correlation coefficient (R) of 0.261 and weighted average of 6.1%. Similarly, the statistical analysis conducted on geographies consisting of 73,761,709 people shows no correlation between the proportion of Okinawans and percentage of population with a disability between the ages 18 and 35 in the United States with a correlation coefficient (R) of -0.048 and weighted average of 5.9%, a difference of 3.6%.
Disability Age 18 to 34 Correlation Summary
| Measurement | Immigrants from Northern Africa | Okinawan |
| Minimum | 2.6% | 0.81% |
| Maximum | 15.5% | 16.4% |
| Range | 12.8% | 15.6% |
| Mean | 6.5% | 6.3% |
| Median | 5.8% | 6.0% |
| Interquartile 25% (IQ1) | 5.0% | 4.7% |
| Interquartile 75% (IQ3) | 6.9% | 7.3% |
| Interquartile Range (IQR) | 1.9% | 2.5% |
| Standard Deviation (Sample) | 2.4% | 3.0% |
| Standard Deviation (Population) | 2.4% | 3.0% |
Similar Demographics by Disability Age 18 to 34
Demographics Similar to Immigrants from Northern Africa by Disability Age 18 to 34
In terms of disability age 18 to 34, the demographic groups most similar to Immigrants from Northern Africa are Barbadian (6.1%, a difference of 0.060%), Israeli (6.1%, a difference of 0.10%), Immigrants from Ireland (6.1%, a difference of 0.17%), Immigrants from Australia (6.1%, a difference of 0.18%), and Immigrants from Chile (6.1%, a difference of 0.22%).
| Demographics | Rating | Rank | Disability Age 18 to 34 |
| Immigrants | Turkey | 99.1 /100 | #75 | Exceptional 6.1% |
| Immigrants | Western Asia | 98.9 /100 | #76 | Exceptional 6.1% |
| Immigrants | Russia | 98.9 /100 | #77 | Exceptional 6.1% |
| Assyrians/Chaldeans/Syriacs | 98.9 /100 | #78 | Exceptional 6.1% |
| Afghans | 98.7 /100 | #79 | Exceptional 6.1% |
| Immigrants | Chile | 98.5 /100 | #80 | Exceptional 6.1% |
| Immigrants | Australia | 98.5 /100 | #81 | Exceptional 6.1% |
| Immigrants | Northern Africa | 98.4 /100 | #82 | Exceptional 6.1% |
| Barbadians | 98.3 /100 | #83 | Exceptional 6.1% |
| Israelis | 98.3 /100 | #84 | Exceptional 6.1% |
| Immigrants | Ireland | 98.2 /100 | #85 | Exceptional 6.1% |
| Immigrants | Kuwait | 98.0 /100 | #86 | Exceptional 6.2% |
| Immigrants | Eastern Europe | 97.9 /100 | #87 | Exceptional 6.2% |
| Cambodians | 97.8 /100 | #88 | Exceptional 6.2% |
| Turks | 97.8 /100 | #89 | Exceptional 6.2% |
Demographics Similar to Okinawans by Disability Age 18 to 34
In terms of disability age 18 to 34, the demographic groups most similar to Okinawans are Egyptian (5.9%, a difference of 0.13%), Immigrants from El Salvador (5.9%, a difference of 0.14%), Immigrants from Indonesia (5.9%, a difference of 0.14%), Immigrants from Belarus (5.9%, a difference of 0.18%), and Immigrants from Malaysia (5.9%, a difference of 0.19%).
| Demographics | Rating | Rank | Disability Age 18 to 34 |
| Immigrants | Peru | 99.8 /100 | #45 | Exceptional 5.9% |
| Immigrants | Korea | 99.8 /100 | #46 | Exceptional 5.9% |
| Immigrants | Egypt | 99.8 /100 | #47 | Exceptional 5.9% |
| Immigrants | Trinidad and Tobago | 99.8 /100 | #48 | Exceptional 5.9% |
| Immigrants | Belarus | 99.8 /100 | #49 | Exceptional 5.9% |
| Immigrants | El Salvador | 99.8 /100 | #50 | Exceptional 5.9% |
| Egyptians | 99.8 /100 | #51 | Exceptional 5.9% |
| Okinawans | 99.7 /100 | #52 | Exceptional 5.9% |
| Immigrants | Indonesia | 99.7 /100 | #53 | Exceptional 5.9% |
| Immigrants | Malaysia | 99.7 /100 | #54 | Exceptional 5.9% |
| Immigrants | Spain | 99.7 /100 | #55 | Exceptional 5.9% |
| Paraguayans | 99.7 /100 | #56 | Exceptional 5.9% |
| Immigrants | Haiti | 99.7 /100 | #57 | Exceptional 5.9% |
| Immigrants | Serbia | 99.7 /100 | #58 | Exceptional 5.9% |
| Immigrants | Caribbean | 99.6 /100 | #59 | Exceptional 6.0% |