Immigrants from Northern Africa vs Immigrants from Belarus Disability Age 65 to 74
COMPARE
Immigrants from Northern Africa
Immigrants from Belarus
Disability Age 65 to 74
Disability Age 65 to 74 Comparison
Immigrants from Northern Africa
Immigrants from Belarus
22.4%
DISABILITY AGE 65 TO 74
94.7/ 100
METRIC RATING
119th/ 347
METRIC RANK
21.7%
DISABILITY AGE 65 TO 74
99.2/ 100
METRIC RATING
71st/ 347
METRIC RANK
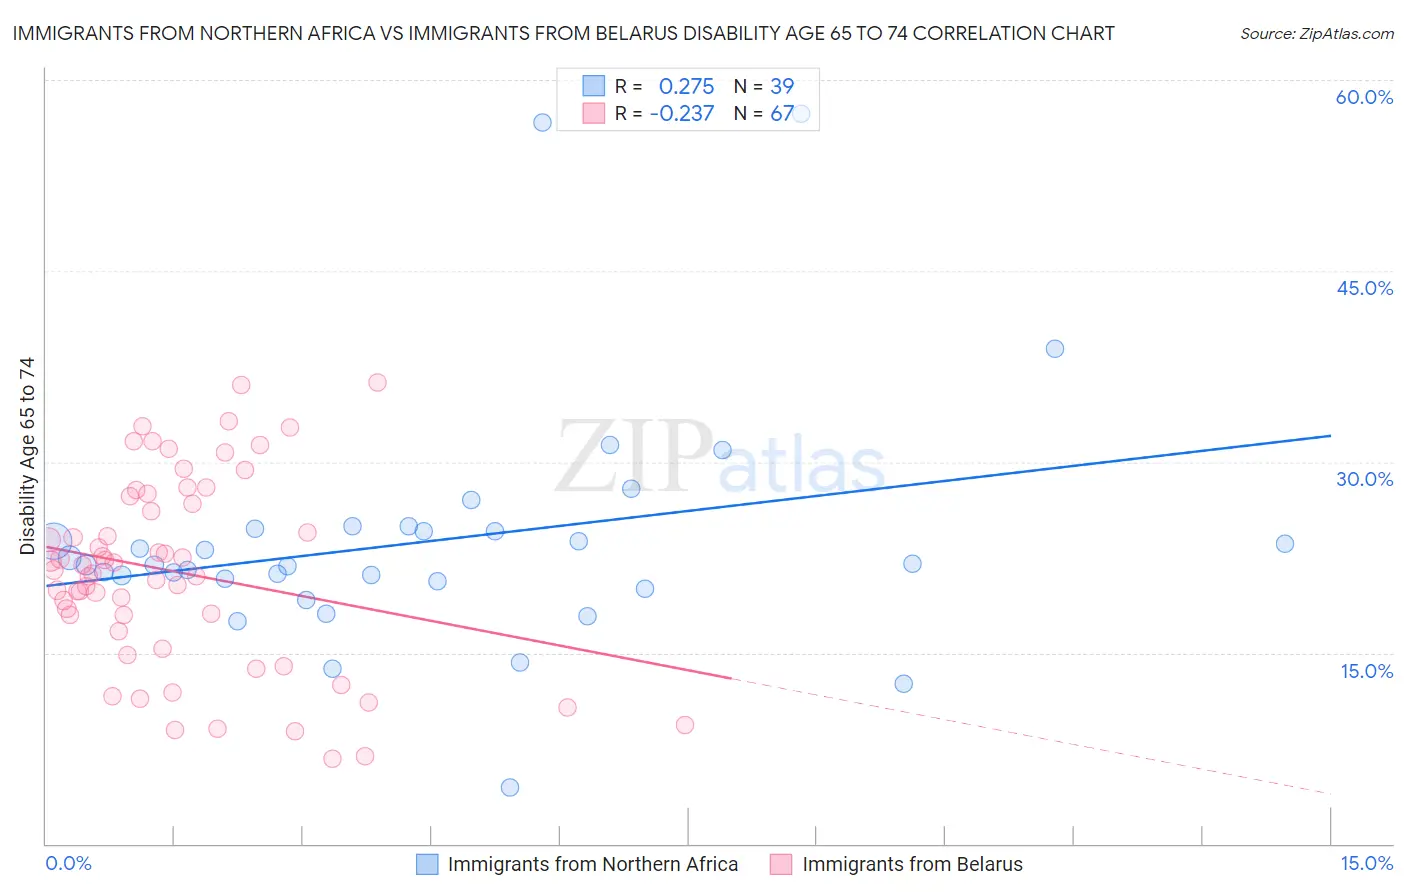
Immigrants from Northern Africa vs Immigrants from Belarus Disability Age 65 to 74 Correlation Chart
The statistical analysis conducted on geographies consisting of 320,869,061 people shows a weak positive correlation between the proportion of Immigrants from Northern Africa and percentage of population with a disability between the ages 65 and 75 in the United States with a correlation coefficient (R) of 0.275 and weighted average of 22.4%. Similarly, the statistical analysis conducted on geographies consisting of 150,158,418 people shows a weak negative correlation between the proportion of Immigrants from Belarus and percentage of population with a disability between the ages 65 and 75 in the United States with a correlation coefficient (R) of -0.237 and weighted average of 21.7%, a difference of 3.0%.
Disability Age 65 to 74 Correlation Summary
| Measurement | Immigrants from Northern Africa | Immigrants from Belarus |
| Minimum | 4.4% | 6.7% |
| Maximum | 57.3% | 36.2% |
| Range | 52.9% | 29.5% |
| Mean | 23.8% | 21.3% |
| Median | 21.9% | 21.5% |
| Interquartile 25% (IQ1) | 20.6% | 16.7% |
| Interquartile 75% (IQ3) | 24.7% | 27.3% |
| Interquartile Range (IQR) | 4.1% | 10.6% |
| Standard Deviation (Sample) | 9.6% | 7.4% |
| Standard Deviation (Population) | 9.5% | 7.4% |
Similar Demographics by Disability Age 65 to 74
Demographics Similar to Immigrants from Northern Africa by Disability Age 65 to 74
In terms of disability age 65 to 74, the demographic groups most similar to Immigrants from Northern Africa are Swedish (22.4%, a difference of 0.010%), Austrian (22.4%, a difference of 0.010%), Brazilian (22.4%, a difference of 0.020%), Laotian (22.3%, a difference of 0.060%), and Ukrainian (22.3%, a difference of 0.12%).
| Demographics | Rating | Rank | Disability Age 65 to 74 |
| Immigrants | South America | 95.5 /100 | #112 | Exceptional 22.3% |
| Syrians | 95.3 /100 | #113 | Exceptional 22.3% |
| Ukrainians | 95.1 /100 | #114 | Exceptional 22.3% |
| Laotians | 94.9 /100 | #115 | Exceptional 22.3% |
| Brazilians | 94.8 /100 | #116 | Exceptional 22.4% |
| Swedes | 94.7 /100 | #117 | Exceptional 22.4% |
| Austrians | 94.7 /100 | #118 | Exceptional 22.4% |
| Immigrants | Northern Africa | 94.7 /100 | #119 | Exceptional 22.4% |
| Immigrants | Kazakhstan | 93.9 /100 | #120 | Exceptional 22.4% |
| Czechs | 93.5 /100 | #121 | Exceptional 22.4% |
| Immigrants | Jordan | 93.5 /100 | #122 | Exceptional 22.4% |
| Hungarians | 93.3 /100 | #123 | Exceptional 22.4% |
| Norwegians | 92.5 /100 | #124 | Exceptional 22.5% |
| Immigrants | Western Europe | 92.3 /100 | #125 | Exceptional 22.5% |
| Lebanese | 92.2 /100 | #126 | Exceptional 22.5% |
Demographics Similar to Immigrants from Belarus by Disability Age 65 to 74
In terms of disability age 65 to 74, the demographic groups most similar to Immigrants from Belarus are Immigrants from Hungary (21.7%, a difference of 0.010%), Immigrants from Egypt (21.7%, a difference of 0.060%), Chinese (21.7%, a difference of 0.060%), Immigrants from Scotland (21.7%, a difference of 0.19%), and Immigrants from Venezuela (21.8%, a difference of 0.20%).
| Demographics | Rating | Rank | Disability Age 65 to 74 |
| Immigrants | Latvia | 99.4 /100 | #64 | Exceptional 21.6% |
| Immigrants | Russia | 99.4 /100 | #65 | Exceptional 21.6% |
| Maltese | 99.4 /100 | #66 | Exceptional 21.6% |
| Immigrants | South Africa | 99.3 /100 | #67 | Exceptional 21.7% |
| Immigrants | Scotland | 99.3 /100 | #68 | Exceptional 21.7% |
| Immigrants | Egypt | 99.2 /100 | #69 | Exceptional 21.7% |
| Chinese | 99.2 /100 | #70 | Exceptional 21.7% |
| Immigrants | Belarus | 99.2 /100 | #71 | Exceptional 21.7% |
| Immigrants | Hungary | 99.2 /100 | #72 | Exceptional 21.7% |
| Immigrants | Venezuela | 99.0 /100 | #73 | Exceptional 21.8% |
| Cambodians | 99.0 /100 | #74 | Exceptional 21.8% |
| Mongolians | 99.0 /100 | #75 | Exceptional 21.8% |
| Greeks | 99.0 /100 | #76 | Exceptional 21.8% |
| Immigrants | Poland | 99.0 /100 | #77 | Exceptional 21.8% |
| Immigrants | Eastern Europe | 99.0 /100 | #78 | Exceptional 21.8% |