Immigrants from Northern Africa vs Icelander Disability Age 35 to 64

COMPARE

Immigrants from Northern Africa
Race
Ancestry
AfghanAfricanAlaska NativeAlaskan AthabascanAlbanianAleutAlsatianAmericanApacheArabArapahoArgentineanArmenianAssyrian/Chaldean/SyriacAustralianAustrianBahamianBangladeshiBarbadianBasqueBelgianBelizeanBermudanBhutaneseBlackfeetBolivianBrazilianBritishBritish West IndianBulgarianBurmeseCajunCambodianCanadianCape VerdeanCarpatho RusynCelticCentral AmericanCentral American IndianCherokeeCheyenneChickasawChileanChineseChippewaChoctawColombianColvilleComancheCosta RicanCreeCreekCroatianCrowCubanCypriotCzechCzechoslovakianDanishDelawareDominicanDutchDutch West IndianEastern EuropeanEcuadorianEgyptianEnglishEstonianEthiopianEuropeanFijianFilipinoFinnishFrenchFrench American IndianFrench CanadianGermanGerman RussianGhanaianGreekGuamanian/ChamorroGuatemalanGuyaneseHaitianHmongHonduranHopiHoumaHungarianIndian (Asian)IndonesianInupiatIranianIraqiIrishIroquoisIsraeliItalianJamaicanJapaneseJordanianKenyanKiowaKoreanLaotianLatvianLebaneseLiberianLithuanianLumbeeLuxembourgerMacedonianMalaysianMalteseMarshalleseMenomineeMexicanMexican American IndianMongolianMoroccanNative HawaiianNavajoNepaleseNew ZealanderNicaraguanNigerianNorthern EuropeanNorwegianOkinawanOsageOttawaPaiutePakistaniPalestinianPanamanianParaguayanPennsylvania GermanPeruvianPimaPolishPortuguesePotawatomiPuebloPuerto RicanPuget Sound SalishRomanianRussianSalvadoranSamoanScandinavianScotch-IrishScottishSeminoleSenegaleseSerbianShoshoneSierra LeoneanSiouxSlavicSlovakSloveneSomaliSouth AfricanSouth AmericanSouth American IndianSoviet UnionSpaniardSpanishSpanish AmericanSpanish American IndianSri LankanSubsaharan AfricanSudaneseSwedishSwissSyrianTaiwaneseThaiTlingit-HaidaTohono O'OdhamTonganTrinidadian and TobagonianTsimshianTurkishU.S. Virgin IslanderUgandanUkrainianUruguayanUteVenezuelanVietnameseWelshWest IndianYakamaYaquiYugoslavianYumanYup'ikZimbabwean
Immigration
NonimmigrantsImmigrantsAfghanistanAfricaAlbaniaArgentinaArmeniaAsiaAustraliaAustriaBahamasBangladeshBarbadosBelarusBelgiumBelizeBoliviaBosnia and HerzegovinaBrazilBulgariaBurma/MyanmarCabo VerdeCambodiaCameroonCanadaCaribbeanCentral AmericaChileChinaColombiaCongoCosta RicaCroatiaCubaCzechoslovakiaDenmarkDominicaDominican RepublicEastern AfricaEastern AsiaEastern EuropeEcuadorEgyptEl SalvadorEnglandEritreaEthiopiaEuropeFijiFranceGermanyGhanaGreeceGrenadaGuatemalaGuyanaHaitiHondurasHong KongHungaryIndiaIndonesiaIranIraqIrelandIsraelItalyJamaicaJapanJordanKazakhstanKenyaKoreaKuwaitLaosLatin AmericaLatviaLebanonLiberiaLithuaniaMalaysiaMexicoMicronesiaMiddle AfricaMoldovaMoroccoNepalNetherlandsNicaraguaNigeriaNorth AmericaNorth MacedoniaNorthern AfricaNorthern EuropeNorwayOceaniaPakistanPanamaPeruPhilippinesPolandPortugalRomaniaRussiaSaudi ArabiaScotlandSenegalSerbiaSierra LeoneSingaporeSomaliaSouth AfricaSouth AmericaSouth Central AsiaSouth Eastern AsiaSouthern EuropeSpainSri LankaSt. Vincent and the GrenadinesSudanSwedenSwitzerlandSyriaTaiwanThailandTrinidad and TobagoTurkeyUgandaUkraineUruguayUzbekistanVenezuelaVietnamWest IndiesWestern AfricaWestern AsiaWestern EuropeYemenZaireZimbabweAzores
Icelander
Race
Ancestry
AfghanAfricanAlaska NativeAlaskan AthabascanAlbanianAleutAlsatianAmericanApacheArabArapahoArgentineanArmenianAssyrian/Chaldean/SyriacAustralianAustrianBahamianBangladeshiBarbadianBasqueBelgianBelizeanBermudanBhutaneseBlackfeetBolivianBrazilianBritishBritish West IndianBulgarianBurmeseCajunCambodianCanadianCape VerdeanCarpatho RusynCelticCentral AmericanCentral American IndianCherokeeCheyenneChickasawChileanChineseChippewaChoctawColombianColvilleComancheCosta RicanCreeCreekCroatianCrowCubanCypriotCzechCzechoslovakianDanishDelawareDominicanDutchDutch West IndianEastern EuropeanEcuadorianEgyptianEnglishEstonianEthiopianEuropeanFijianFilipinoFinnishFrenchFrench American IndianFrench CanadianGermanGerman RussianGhanaianGreekGuamanian/ChamorroGuatemalanGuyaneseHaitianHmongHonduranHopiHoumaHungarianIcelanderIndian (Asian)IndonesianInupiatIranianIraqiIrishIroquoisIsraeliItalianJamaicanJapaneseJordanianKenyanKiowaKoreanLaotianLatvianLebaneseLiberianLithuanianLumbeeLuxembourgerMacedonianMalaysianMalteseMarshalleseMenomineeMexicanMexican American IndianMongolianMoroccanNative HawaiianNavajoNepaleseNew ZealanderNicaraguanNigerianNorthern EuropeanNorwegianOkinawanOsageOttawaPaiutePakistaniPalestinianPanamanianParaguayanPennsylvania GermanPeruvianPimaPolishPortuguesePotawatomiPuebloPuerto RicanPuget Sound SalishRomanianRussianSalvadoranSamoanScandinavianScotch-IrishScottishSeminoleSenegaleseSerbianShoshoneSierra LeoneanSiouxSlavicSlovakSloveneSomaliSouth AfricanSouth AmericanSouth American IndianSoviet UnionSpaniardSpanishSpanish AmericanSpanish American IndianSri LankanSubsaharan AfricanSudaneseSwedishSwissSyrianTaiwaneseThaiTlingit-HaidaTohono O'OdhamTonganTrinidadian and TobagonianTsimshianTurkishU.S. Virgin IslanderUgandanUkrainianUruguayanUteVenezuelanVietnameseWelshWest IndianYakamaYaquiYugoslavianYumanYup'ikZimbabwean
Immigration
NonimmigrantsImmigrantsAfghanistanAfricaAlbaniaArgentinaArmeniaAsiaAustraliaAustriaBahamasBangladeshBarbadosBelarusBelgiumBelizeBoliviaBosnia and HerzegovinaBrazilBulgariaBurma/MyanmarCabo VerdeCambodiaCameroonCanadaCaribbeanCentral AmericaChileChinaColombiaCongoCosta RicaCroatiaCubaCzechoslovakiaDenmarkDominicaDominican RepublicEastern AfricaEastern AsiaEastern EuropeEcuadorEgyptEl SalvadorEnglandEritreaEthiopiaEuropeFijiFranceGermanyGhanaGreeceGrenadaGuatemalaGuyanaHaitiHondurasHong KongHungaryIndiaIndonesiaIranIraqIrelandIsraelItalyJamaicaJapanJordanKazakhstanKenyaKoreaKuwaitLaosLatin AmericaLatviaLebanonLiberiaLithuaniaMalaysiaMexicoMicronesiaMiddle AfricaMoldovaMoroccoNepalNetherlandsNicaraguaNigeriaNorth AmericaNorth MacedoniaNorthern EuropeNorwayOceaniaPakistanPanamaPeruPhilippinesPolandPortugalRomaniaRussiaSaudi ArabiaScotlandSenegalSerbiaSierra LeoneSingaporeSomaliaSouth AfricaSouth AmericaSouth Central AsiaSouth Eastern AsiaSouthern EuropeSpainSri LankaSt. Vincent and the GrenadinesSudanSwedenSwitzerlandSyriaTaiwanThailandTrinidad and TobagoTurkeyUgandaUkraineUruguayUzbekistanVenezuelaVietnamWest IndiesWestern AfricaWestern AsiaWestern EuropeYemenZaireZimbabweAzores
Disability Age 35 to 64
Income
Poverty
Unemployment
Labor Participation
Family Structure
Vehicle Availability
Education Level
Disability

Disability Age 35 to 64 Comparison

Immigrants from Northern Africa

Icelanders

Exceptional
Fair
10.3%
DISABILITY AGE 35 TO 64
98.7/ 100
METRIC RATING
92nd/ 347
METRIC RANK
11.4%
DISABILITY AGE 35 TO 64
39.7/ 100
METRIC RATING
182nd/ 347
METRIC RANK

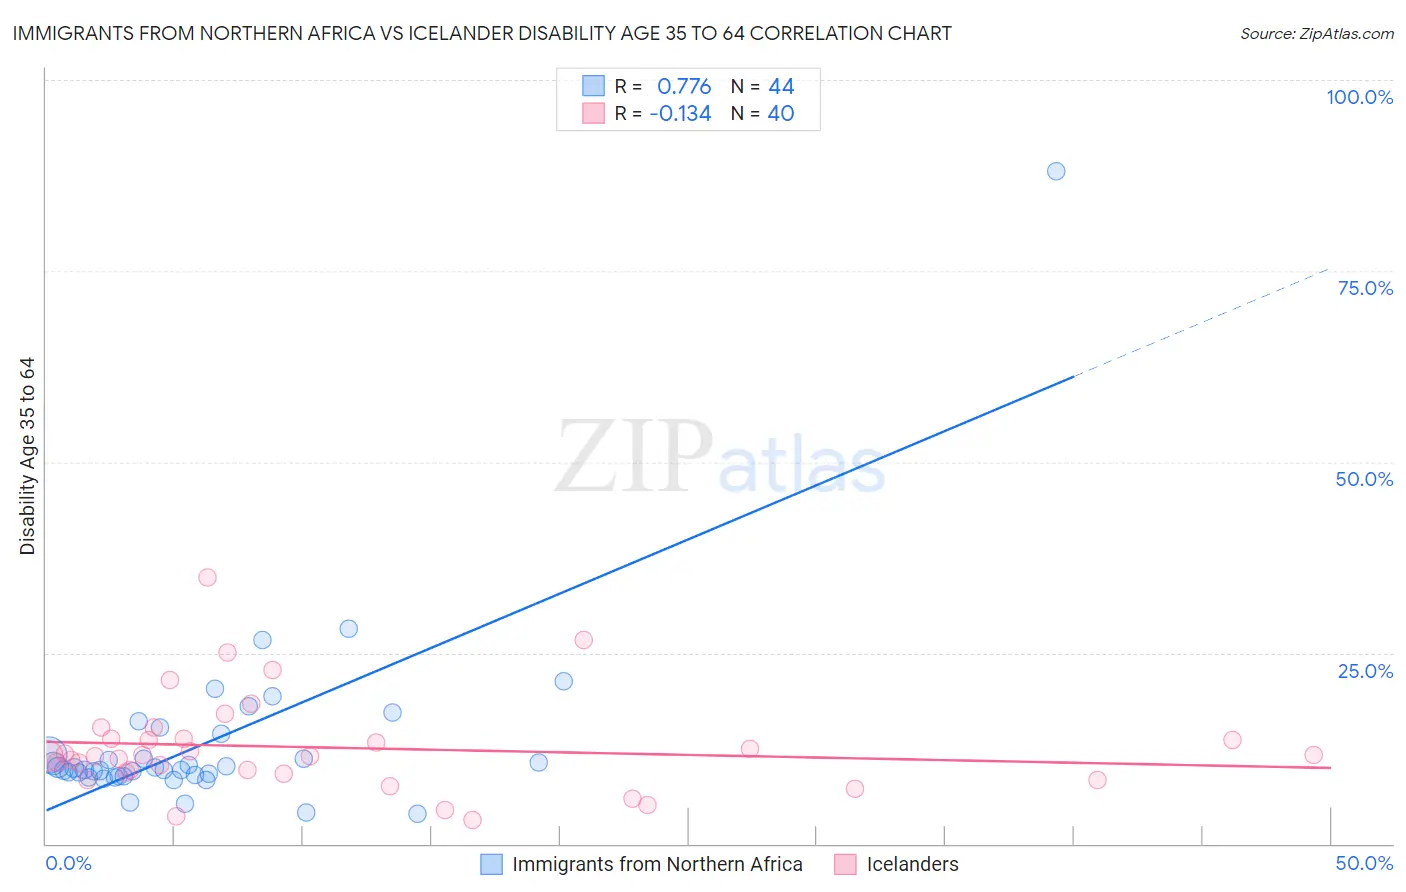
Immigrants from Northern Africa vs Icelander Disability Age 35 to 64 Correlation Chart

The statistical analysis conducted on geographies consisting of 321,070,007 people shows a strong positive correlation between the proportion of Immigrants from Northern Africa and percentage of population with a disability between the ages 34 and 64 in the United States with a correlation coefficient (R) of 0.776 and weighted average of 10.3%. Similarly, the statistical analysis conducted on geographies consisting of 159,603,880 people shows a poor negative correlation between the proportion of Icelanders and percentage of population with a disability between the ages 34 and 64 in the United States with a correlation coefficient (R) of -0.134 and weighted average of 11.4%, a difference of 10.5%.
Immigrants from Northern Africa vs Icelander Disability Age 35 to 64

Disability Age 35 to 64 Correlation Summary

MeasurementImmigrants from Northern AfricaIcelander
Minimum3.9%3.0%
Maximum88.0%34.9%
Range84.1%31.9%
Mean13.3%12.6%
Median9.8%11.5%
Interquartile 25% (IQ1)8.9%9.2%
Interquartile 75% (IQ3)13.0%13.8%
Interquartile Range (IQR)4.1%4.5%
Standard Deviation (Sample)12.7%6.4%
Standard Deviation (Population)12.5%6.3%

Similar Demographics by Disability Age 35 to 64

Demographics Similar to Immigrants from Northern Africa by Disability Age 35 to 64

In terms of disability age 35 to 64, the demographic groups most similar to Immigrants from Northern Africa are Immigrants from North Macedonia (10.3%, a difference of 0.090%), Immigrants from Italy (10.3%, a difference of 0.12%), Chinese (10.3%, a difference of 0.13%), Immigrants from Lebanon (10.3%, a difference of 0.31%), and Afghan (10.3%, a difference of 0.33%).
DemographicsRating | RankDisability Age 35 to 64
Immigrants | Kuwait
99.1
/100
|
#85
Exceptional
10.2%
Immigrants | Europe
99.1
/100
|
#86
Exceptional
10.2%
Nicaraguans
99.1
/100
|
#87
Exceptional
10.2%
Chileans
99.0
/100
|
#88
Exceptional
10.2%
Uruguayans
99.0
/100
|
#89
Exceptional
10.2%
Afghans
98.9
/100
|
#90
Exceptional
10.3%
Immigrants | Lebanon
98.9
/100
|
#91
Exceptional
10.3%
Immigrants | Northern Africa
98.7
/100
|
#92
Exceptional
10.3%
Immigrants | North Macedonia
98.7
/100
|
#93
Exceptional
10.3%
Immigrants | Italy
98.7
/100
|
#94
Exceptional
10.3%
Chinese
98.7
/100
|
#95
Exceptional
10.3%
Immigrants | South Africa
98.5
/100
|
#96
Exceptional
10.3%
Immigrants | Denmark
98.4
/100
|
#97
Exceptional
10.3%
Immigrants | Uruguay
98.3
/100
|
#98
Exceptional
10.3%
Palestinians
98.2
/100
|
#99
Exceptional
10.4%

Demographics Similar to Icelanders by Disability Age 35 to 64

In terms of disability age 35 to 64, the demographic groups most similar to Icelanders are Immigrants from Oceania (11.4%, a difference of 0.020%), Kenyan (11.4%, a difference of 0.040%), Trinidadian and Tobagonian (11.4%, a difference of 0.090%), Immigrants from Barbados (11.3%, a difference of 0.15%), and Immigrants from Caribbean (11.3%, a difference of 0.15%).
DemographicsRating | RankDisability Age 35 to 64
Czechs
47.9
/100
|
#175
Average
11.3%
Ugandans
43.7
/100
|
#176
Average
11.3%
Immigrants | Eastern Africa
42.2
/100
|
#177
Average
11.3%
Poles
42.0
/100
|
#178
Average
11.3%
Immigrants | Barbados
41.6
/100
|
#179
Average
11.3%
Immigrants | Caribbean
41.5
/100
|
#180
Average
11.3%
Trinidadians and Tobagonians
40.8
/100
|
#181
Average
11.4%
Icelanders
39.7
/100
|
#182
Fair
11.4%
Immigrants | Oceania
39.5
/100
|
#183
Fair
11.4%
Kenyans
39.2
/100
|
#184
Fair
11.4%
Danes
36.8
/100
|
#185
Fair
11.4%
Slovenes
36.6
/100
|
#186
Fair
11.4%
Immigrants | Bosnia and Herzegovina
35.2
/100
|
#187
Fair
11.4%
Northern Europeans
34.9
/100
|
#188
Fair
11.4%
Hungarians
34.6
/100
|
#189
Fair
11.4%