Immigrants from Nicaragua vs Menominee Cognitive Disability
COMPARE
Immigrants from Nicaragua
Menominee
Cognitive Disability
Cognitive Disability Comparison
Immigrants from Nicaragua
Menominee
16.8%
COGNITIVE DISABILITY
97.8/ 100
METRIC RATING
107th/ 347
METRIC RANK
18.0%
COGNITIVE DISABILITY
0.4/ 100
METRIC RATING
264th/ 347
METRIC RANK
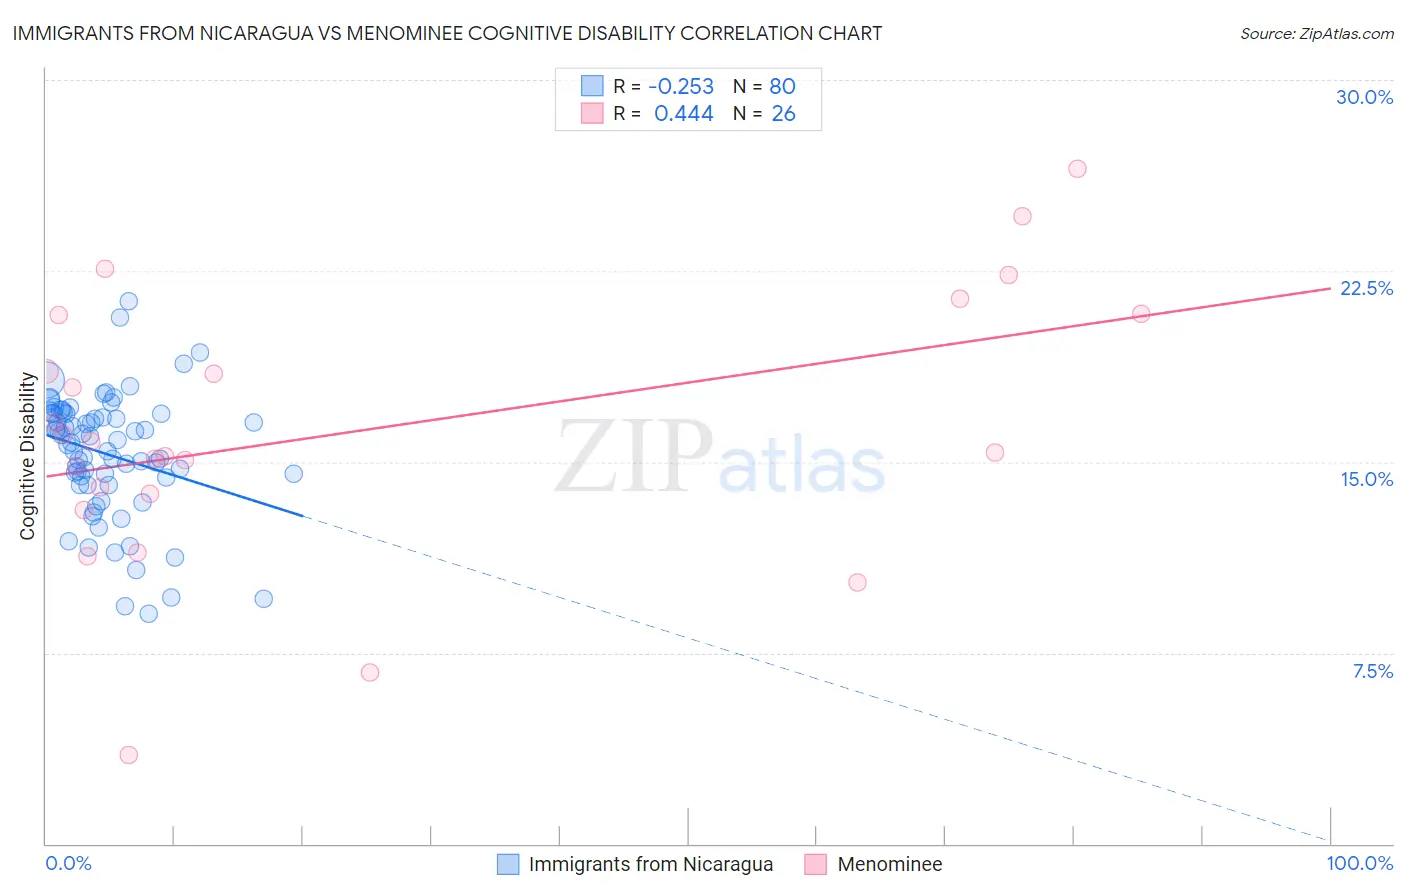
Immigrants from Nicaragua vs Menominee Cognitive Disability Correlation Chart
The statistical analysis conducted on geographies consisting of 236,326,974 people shows a weak negative correlation between the proportion of Immigrants from Nicaragua and percentage of population with cognitive disability in the United States with a correlation coefficient (R) of -0.253 and weighted average of 16.8%. Similarly, the statistical analysis conducted on geographies consisting of 45,777,849 people shows a moderate positive correlation between the proportion of Menominee and percentage of population with cognitive disability in the United States with a correlation coefficient (R) of 0.444 and weighted average of 18.0%, a difference of 6.8%.
Cognitive Disability Correlation Summary
| Measurement | Immigrants from Nicaragua | Menominee |
| Minimum | 9.1% | 3.5% |
| Maximum | 21.3% | 26.5% |
| Range | 12.2% | 23.0% |
| Mean | 15.3% | 16.2% |
| Median | 15.8% | 15.6% |
| Interquartile 25% (IQ1) | 14.2% | 13.7% |
| Interquartile 75% (IQ3) | 16.9% | 20.8% |
| Interquartile Range (IQR) | 2.7% | 7.0% |
| Standard Deviation (Sample) | 2.4% | 5.3% |
| Standard Deviation (Population) | 2.4% | 5.2% |
Similar Demographics by Cognitive Disability
Demographics Similar to Immigrants from Nicaragua by Cognitive Disability
In terms of cognitive disability, the demographic groups most similar to Immigrants from Nicaragua are Northern European (16.8%, a difference of 0.020%), Immigrants from Eastern Asia (16.8%, a difference of 0.060%), Paraguayan (16.8%, a difference of 0.070%), Palestinian (16.8%, a difference of 0.070%), and Canadian (16.8%, a difference of 0.090%).
| Demographics | Rating | Rank | Cognitive Disability |
| Immigrants | Russia | 98.2 /100 | #100 | Exceptional 16.8% |
| Immigrants | Asia | 98.1 /100 | #101 | Exceptional 16.8% |
| Irish | 98.1 /100 | #102 | Exceptional 16.8% |
| Paraguayans | 98.0 /100 | #103 | Exceptional 16.8% |
| Palestinians | 98.0 /100 | #104 | Exceptional 16.8% |
| Immigrants | Eastern Asia | 97.9 /100 | #105 | Exceptional 16.8% |
| Northern Europeans | 97.8 /100 | #106 | Exceptional 16.8% |
| Immigrants | Nicaragua | 97.8 /100 | #107 | Exceptional 16.8% |
| Canadians | 97.5 /100 | #108 | Exceptional 16.8% |
| Albanians | 97.3 /100 | #109 | Exceptional 16.8% |
| Arapaho | 97.3 /100 | #110 | Exceptional 16.8% |
| Uruguayans | 97.2 /100 | #111 | Exceptional 16.8% |
| Indians (Asian) | 97.2 /100 | #112 | Exceptional 16.8% |
| Immigrants | Sri Lanka | 97.1 /100 | #113 | Exceptional 16.8% |
| Koreans | 97.1 /100 | #114 | Exceptional 16.8% |
Demographics Similar to Menominee by Cognitive Disability
In terms of cognitive disability, the demographic groups most similar to Menominee are Spanish American (18.0%, a difference of 0.030%), Belizean (18.0%, a difference of 0.030%), Immigrants from Barbados (17.9%, a difference of 0.060%), Nepalese (18.0%, a difference of 0.090%), and Sierra Leonean (17.9%, a difference of 0.10%).
| Demographics | Rating | Rank | Cognitive Disability |
| Mexican American Indians | 0.6 /100 | #257 | Tragic 17.9% |
| Immigrants | Armenia | 0.6 /100 | #258 | Tragic 17.9% |
| Ethiopians | 0.5 /100 | #259 | Tragic 17.9% |
| Immigrants | Belize | 0.5 /100 | #260 | Tragic 17.9% |
| Guamanians/Chamorros | 0.5 /100 | #261 | Tragic 17.9% |
| Sierra Leoneans | 0.4 /100 | #262 | Tragic 17.9% |
| Immigrants | Barbados | 0.4 /100 | #263 | Tragic 17.9% |
| Menominee | 0.4 /100 | #264 | Tragic 18.0% |
| Spanish Americans | 0.4 /100 | #265 | Tragic 18.0% |
| Belizeans | 0.4 /100 | #266 | Tragic 18.0% |
| Nepalese | 0.3 /100 | #267 | Tragic 18.0% |
| Cherokee | 0.3 /100 | #268 | Tragic 18.0% |
| Hondurans | 0.3 /100 | #269 | Tragic 18.0% |
| Immigrants | Bahamas | 0.3 /100 | #270 | Tragic 18.0% |
| Potawatomi | 0.2 /100 | #271 | Tragic 18.0% |