Immigrants from Morocco vs South American Indian Disability Age 35 to 64

COMPARE

Immigrants from Morocco
Race
Ancestry
AfghanAfricanAlaska NativeAlaskan AthabascanAlbanianAleutAlsatianAmericanApacheArabArapahoArgentineanArmenianAssyrian/Chaldean/SyriacAustralianAustrianBahamianBangladeshiBarbadianBasqueBelgianBelizeanBermudanBhutaneseBlackfeetBolivianBrazilianBritishBritish West IndianBulgarianBurmeseCajunCambodianCanadianCape VerdeanCarpatho RusynCelticCentral AmericanCentral American IndianCherokeeCheyenneChickasawChileanChineseChippewaChoctawColombianColvilleComancheCosta RicanCreeCreekCroatianCrowCubanCypriotCzechCzechoslovakianDanishDelawareDominicanDutchDutch West IndianEastern EuropeanEcuadorianEgyptianEnglishEstonianEthiopianEuropeanFijianFilipinoFinnishFrenchFrench American IndianFrench CanadianGermanGerman RussianGhanaianGreekGuamanian/ChamorroGuatemalanGuyaneseHaitianHmongHonduranHopiHoumaHungarianIcelanderIndian (Asian)IndonesianInupiatIranianIraqiIrishIroquoisIsraeliItalianJamaicanJapaneseJordanianKenyanKiowaKoreanLaotianLatvianLebaneseLiberianLithuanianLumbeeLuxembourgerMacedonianMalaysianMalteseMarshalleseMenomineeMexicanMexican American IndianMongolianMoroccanNative HawaiianNavajoNepaleseNew ZealanderNicaraguanNigerianNorthern EuropeanNorwegianOkinawanOsageOttawaPaiutePakistaniPalestinianPanamanianParaguayanPennsylvania GermanPeruvianPimaPolishPortuguesePotawatomiPuebloPuerto RicanPuget Sound SalishRomanianRussianSalvadoranSamoanScandinavianScotch-IrishScottishSeminoleSenegaleseSerbianShoshoneSierra LeoneanSiouxSlavicSlovakSloveneSomaliSouth AfricanSouth AmericanSoviet UnionSpaniardSpanishSpanish AmericanSpanish American IndianSri LankanSubsaharan AfricanSudaneseSwedishSwissSyrianTaiwaneseThaiTlingit-HaidaTohono O'OdhamTonganTrinidadian and TobagonianTsimshianTurkishU.S. Virgin IslanderUgandanUkrainianUruguayanUteVenezuelanVietnameseWelshWest IndianYakamaYaquiYugoslavianYumanYup'ikZimbabwean
Immigration
NonimmigrantsImmigrantsAfghanistanAfricaAlbaniaArgentinaArmeniaAsiaAustraliaAustriaBahamasBangladeshBarbadosBelarusBelgiumBelizeBoliviaBosnia and HerzegovinaBrazilBulgariaBurma/MyanmarCabo VerdeCambodiaCameroonCanadaCaribbeanCentral AmericaChileChinaColombiaCongoCosta RicaCroatiaCubaCzechoslovakiaDenmarkDominicaDominican RepublicEastern AfricaEastern AsiaEastern EuropeEcuadorEgyptEl SalvadorEnglandEritreaEthiopiaEuropeFijiFranceGermanyGhanaGreeceGrenadaGuatemalaGuyanaHaitiHondurasHong KongHungaryIndiaIndonesiaIranIraqIrelandIsraelItalyJamaicaJapanJordanKazakhstanKenyaKoreaKuwaitLaosLatin AmericaLatviaLebanonLiberiaLithuaniaMalaysiaMexicoMicronesiaMiddle AfricaMoldovaMoroccoNepalNetherlandsNicaraguaNigeriaNorth AmericaNorth MacedoniaNorthern AfricaNorthern EuropeNorwayOceaniaPakistanPanamaPeruPhilippinesPolandPortugalRomaniaRussiaSaudi ArabiaScotlandSenegalSerbiaSierra LeoneSingaporeSomaliaSouth AfricaSouth AmericaSouth Central AsiaSouth Eastern AsiaSouthern EuropeSpainSri LankaSt. Vincent and the GrenadinesSudanSwedenSwitzerlandSyriaTaiwanThailandTrinidad and TobagoTurkeyUgandaUkraineUruguayUzbekistanVenezuelaVietnamWest IndiesWestern AfricaWestern AsiaWestern EuropeYemenZaireZimbabweAzores
South American Indian
Race
Ancestry
AfghanAfricanAlaska NativeAlaskan AthabascanAlbanianAleutAlsatianAmericanApacheArabArapahoArgentineanArmenianAssyrian/Chaldean/SyriacAustralianAustrianBahamianBangladeshiBarbadianBasqueBelgianBelizeanBermudanBhutaneseBlackfeetBolivianBrazilianBritishBritish West IndianBulgarianBurmeseCajunCambodianCanadianCape VerdeanCarpatho RusynCelticCentral AmericanCentral American IndianCherokeeCheyenneChickasawChileanChineseChippewaChoctawColombianColvilleComancheCosta RicanCreeCreekCroatianCrowCubanCypriotCzechCzechoslovakianDanishDelawareDominicanDutchDutch West IndianEastern EuropeanEcuadorianEgyptianEnglishEstonianEthiopianEuropeanFijianFilipinoFinnishFrenchFrench American IndianFrench CanadianGermanGerman RussianGhanaianGreekGuamanian/ChamorroGuatemalanGuyaneseHaitianHmongHonduranHopiHoumaHungarianIcelanderIndian (Asian)IndonesianInupiatIranianIraqiIrishIroquoisIsraeliItalianJamaicanJapaneseJordanianKenyanKiowaKoreanLaotianLatvianLebaneseLiberianLithuanianLumbeeLuxembourgerMacedonianMalaysianMalteseMarshalleseMenomineeMexicanMexican American IndianMongolianMoroccanNative HawaiianNavajoNepaleseNew ZealanderNicaraguanNigerianNorthern EuropeanNorwegianOkinawanOsageOttawaPaiutePakistaniPalestinianPanamanianParaguayanPennsylvania GermanPeruvianPimaPolishPortuguesePotawatomiPuebloPuerto RicanPuget Sound SalishRomanianRussianSalvadoranSamoanScandinavianScotch-IrishScottishSeminoleSenegaleseSerbianShoshoneSierra LeoneanSiouxSlavicSlovakSloveneSomaliSouth AfricanSouth AmericanSouth American IndianSoviet UnionSpaniardSpanishSpanish AmericanSpanish American IndianSri LankanSubsaharan AfricanSudaneseSwedishSwissSyrianTaiwaneseThaiTlingit-HaidaTohono O'OdhamTonganTrinidadian and TobagonianTsimshianTurkishU.S. Virgin IslanderUgandanUkrainianUruguayanUteVenezuelanVietnameseWelshWest IndianYakamaYaquiYugoslavianYumanYup'ikZimbabwean
Immigration
NonimmigrantsImmigrantsAfghanistanAfricaAlbaniaArgentinaArmeniaAsiaAustraliaAustriaBahamasBangladeshBarbadosBelarusBelgiumBelizeBoliviaBosnia and HerzegovinaBrazilBulgariaBurma/MyanmarCabo VerdeCambodiaCameroonCanadaCaribbeanCentral AmericaChileChinaColombiaCongoCosta RicaCroatiaCubaCzechoslovakiaDenmarkDominicaDominican RepublicEastern AfricaEastern AsiaEastern EuropeEcuadorEgyptEl SalvadorEnglandEritreaEthiopiaEuropeFijiFranceGermanyGhanaGreeceGrenadaGuatemalaGuyanaHaitiHondurasHong KongHungaryIndiaIndonesiaIranIraqIrelandIsraelItalyJamaicaJapanJordanKazakhstanKenyaKoreaKuwaitLaosLatin AmericaLatviaLebanonLiberiaLithuaniaMalaysiaMexicoMicronesiaMiddle AfricaMoldovaNepalNetherlandsNicaraguaNigeriaNorth AmericaNorth MacedoniaNorthern AfricaNorthern EuropeNorwayOceaniaPakistanPanamaPeruPhilippinesPolandPortugalRomaniaRussiaSaudi ArabiaScotlandSenegalSerbiaSierra LeoneSingaporeSomaliaSouth AfricaSouth AmericaSouth Central AsiaSouth Eastern AsiaSouthern EuropeSpainSri LankaSt. Vincent and the GrenadinesSudanSwedenSwitzerlandSyriaTaiwanThailandTrinidad and TobagoTurkeyUgandaUkraineUruguayUzbekistanVenezuelaVietnamWest IndiesWestern AfricaWestern AsiaWestern EuropeYemenZaireZimbabweAzores
Disability Age 35 to 64
Income
Poverty
Unemployment
Labor Participation
Family Structure
Vehicle Availability
Education Level
Disability

Disability Age 35 to 64 Comparison

Immigrants from Morocco

South American Indians

Exceptional
Excellent
10.5%
DISABILITY AGE 35 TO 64
96.6/ 100
METRIC RATING
114th/ 347
METRIC RANK
10.9%
DISABILITY AGE 35 TO 64
83.5/ 100
METRIC RATING
146th/ 347
METRIC RANK

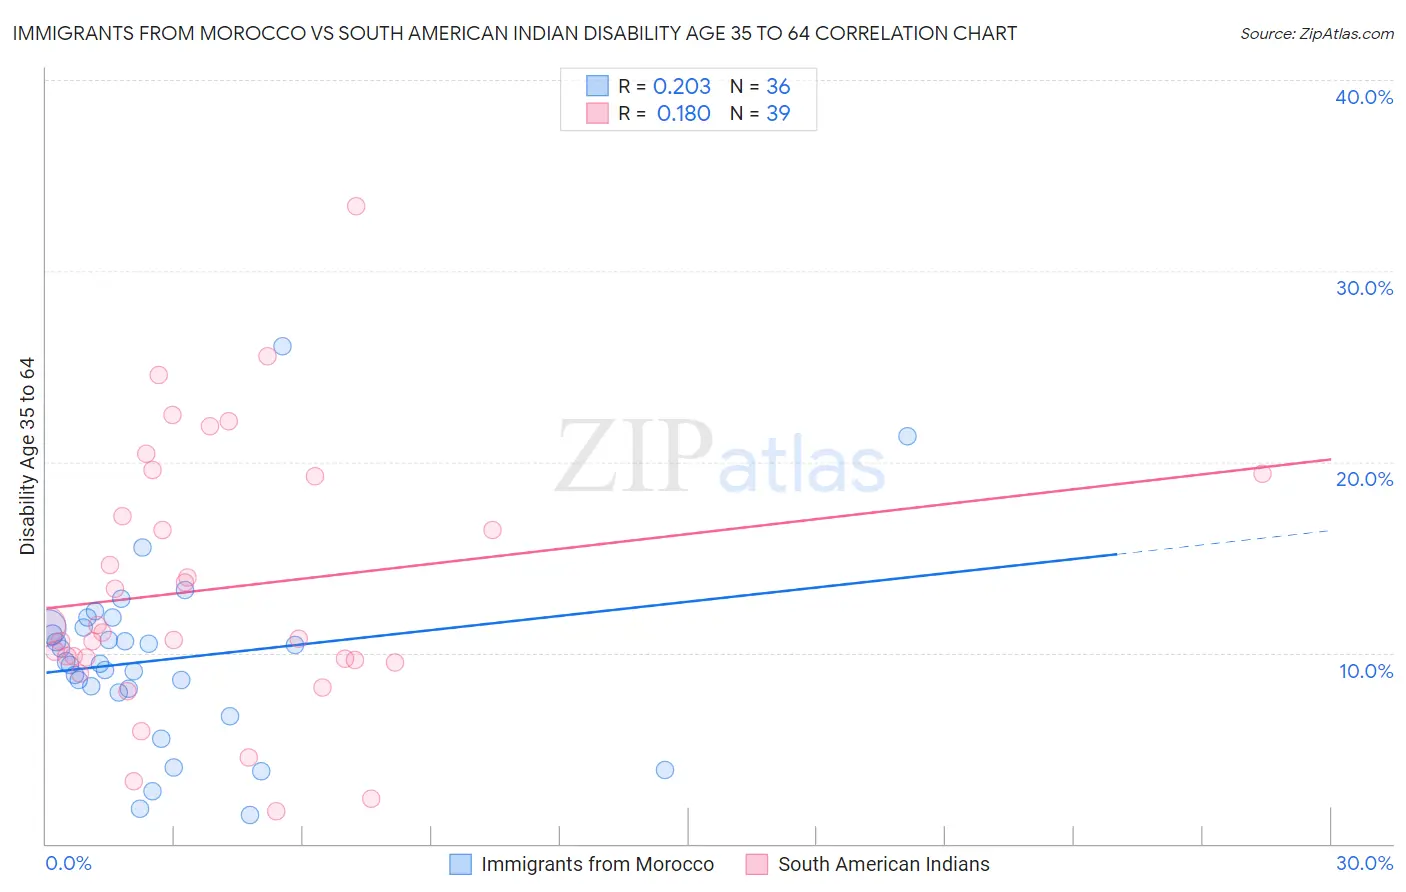
Immigrants from Morocco vs South American Indian Disability Age 35 to 64 Correlation Chart

The statistical analysis conducted on geographies consisting of 178,904,714 people shows a weak positive correlation between the proportion of Immigrants from Morocco and percentage of population with a disability between the ages 34 and 64 in the United States with a correlation coefficient (R) of 0.203 and weighted average of 10.5%. Similarly, the statistical analysis conducted on geographies consisting of 164,539,388 people shows a poor positive correlation between the proportion of South American Indians and percentage of population with a disability between the ages 34 and 64 in the United States with a correlation coefficient (R) of 0.180 and weighted average of 10.9%, a difference of 3.7%.
Immigrants from Morocco vs South American Indian Disability Age 35 to 64

Disability Age 35 to 64 Correlation Summary

MeasurementImmigrants from MoroccoSouth American Indian
Minimum1.5%1.7%
Maximum26.0%33.4%
Range24.5%31.7%
Mean9.7%13.4%
Median9.5%11.1%
Interquartile 25% (IQ1)8.0%9.6%
Interquartile 75% (IQ3)11.3%19.3%
Interquartile Range (IQR)3.3%9.6%
Standard Deviation (Sample)4.8%6.9%
Standard Deviation (Population)4.7%6.8%

Similar Demographics by Disability Age 35 to 64

Demographics Similar to Immigrants from Morocco by Disability Age 35 to 64

In terms of disability age 35 to 64, the demographic groups most similar to Immigrants from Morocco are Tongan (10.5%, a difference of 0.050%), Assyrian/Chaldean/Syriac (10.5%, a difference of 0.17%), Immigrants from Netherlands (10.5%, a difference of 0.17%), Brazilian (10.5%, a difference of 0.20%), and Korean (10.5%, a difference of 0.40%).
DemographicsRating | RankDisability Age 35 to 64
Zimbabweans
97.4
/100
|
#107
Exceptional
10.4%
Ethiopians
97.4
/100
|
#108
Exceptional
10.5%
Immigrants | Ethiopia
97.2
/100
|
#109
Exceptional
10.5%
Koreans
97.1
/100
|
#110
Exceptional
10.5%
Brazilians
96.9
/100
|
#111
Exceptional
10.5%
Assyrians/Chaldeans/Syriacs
96.8
/100
|
#112
Exceptional
10.5%
Tongans
96.6
/100
|
#113
Exceptional
10.5%
Immigrants | Morocco
96.6
/100
|
#114
Exceptional
10.5%
Immigrants | Netherlands
96.3
/100
|
#115
Exceptional
10.5%
Immigrants | Nepal
95.9
/100
|
#116
Exceptional
10.6%
Immigrants | South Eastern Asia
95.7
/100
|
#117
Exceptional
10.6%
Immigrants | Moldova
95.5
/100
|
#118
Exceptional
10.6%
Luxembourgers
95.5
/100
|
#119
Exceptional
10.6%
Vietnamese
95.4
/100
|
#120
Exceptional
10.6%
Romanians
95.0
/100
|
#121
Exceptional
10.6%

Demographics Similar to South American Indians by Disability Age 35 to 64

In terms of disability age 35 to 64, the demographic groups most similar to South American Indians are Immigrants from Eritrea (10.9%, a difference of 0.020%), Arab (10.9%, a difference of 0.12%), Immigrants from Bangladesh (10.9%, a difference of 0.34%), Immigrants from Cameroon (10.9%, a difference of 0.34%), and Syrian (11.0%, a difference of 0.51%).
DemographicsRating | RankDisability Age 35 to 64
Costa Ricans
91.4
/100
|
#139
Exceptional
10.7%
Immigrants | Scotland
91.3
/100
|
#140
Exceptional
10.7%
Australians
90.7
/100
|
#141
Exceptional
10.8%
Immigrants | Saudi Arabia
90.6
/100
|
#142
Exceptional
10.8%
Sierra Leoneans
89.7
/100
|
#143
Excellent
10.8%
Lithuanians
88.7
/100
|
#144
Excellent
10.8%
Immigrants | Bangladesh
85.6
/100
|
#145
Excellent
10.9%
South American Indians
83.5
/100
|
#146
Excellent
10.9%
Immigrants | Eritrea
83.4
/100
|
#147
Excellent
10.9%
Arabs
82.7
/100
|
#148
Excellent
10.9%
Immigrants | Cameroon
81.1
/100
|
#149
Excellent
10.9%
Syrians
79.8
/100
|
#150
Good
11.0%
New Zealanders
79.3
/100
|
#151
Good
11.0%
Ukrainians
78.0
/100
|
#152
Good
11.0%
Immigrants | England
77.4
/100
|
#153
Good
11.0%