Immigrants from Moldova vs Cypriot Hearing Disability
COMPARE
Immigrants from Moldova
Cypriot
Hearing Disability
Hearing Disability Comparison
Immigrants from Moldova
Cypriots
3.0%
HEARING DISABILITY
43.1/ 100
METRIC RATING
179th/ 347
METRIC RANK
2.8%
HEARING DISABILITY
92.9/ 100
METRIC RATING
110th/ 347
METRIC RANK
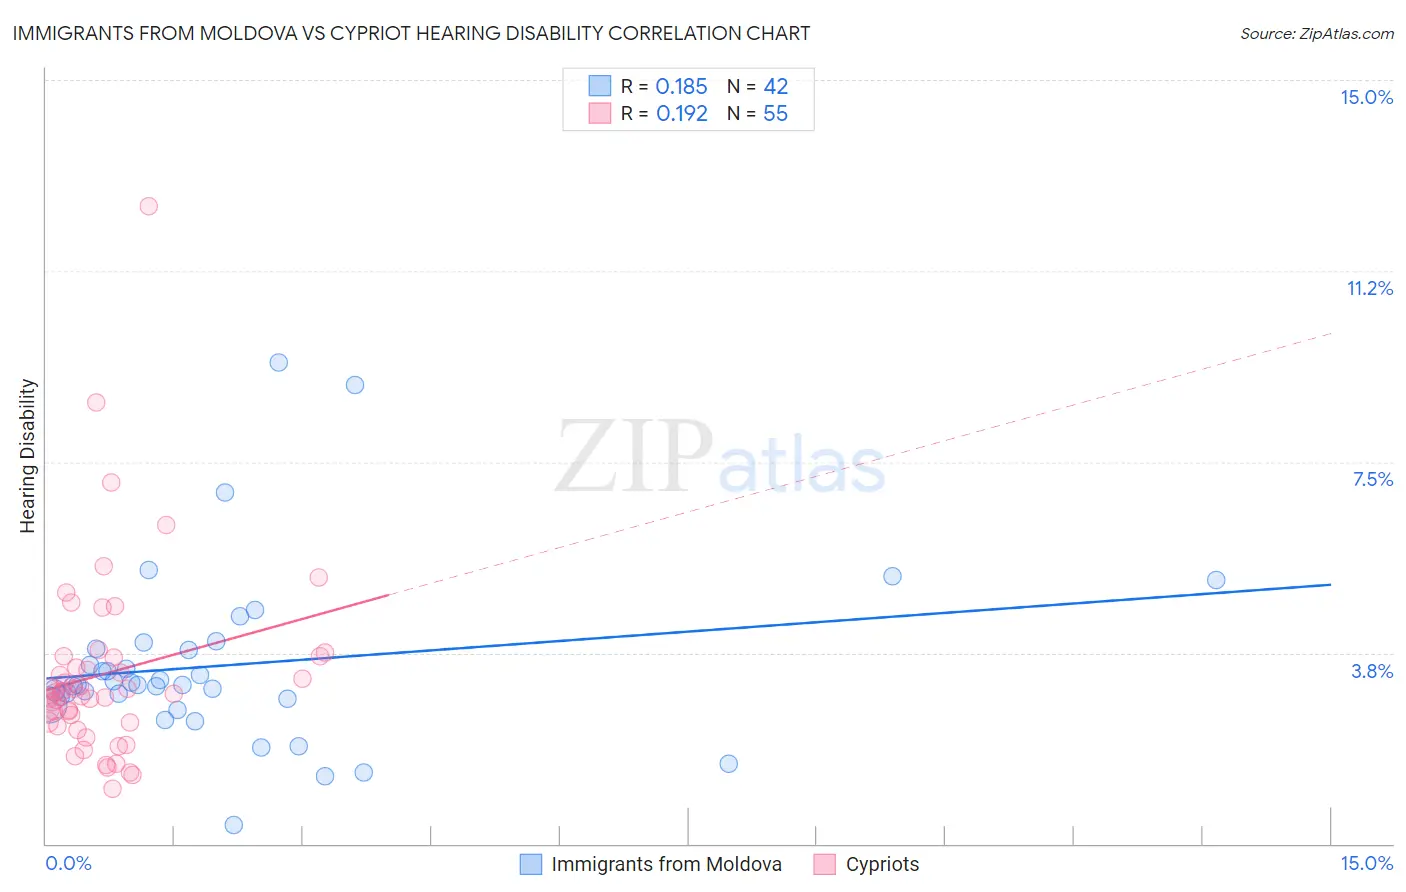
Immigrants from Moldova vs Cypriot Hearing Disability Correlation Chart
The statistical analysis conducted on geographies consisting of 124,366,720 people shows a poor positive correlation between the proportion of Immigrants from Moldova and percentage of population with hearing disability in the United States with a correlation coefficient (R) of 0.185 and weighted average of 3.0%. Similarly, the statistical analysis conducted on geographies consisting of 61,868,814 people shows a poor positive correlation between the proportion of Cypriots and percentage of population with hearing disability in the United States with a correlation coefficient (R) of 0.192 and weighted average of 2.8%, a difference of 7.1%.
Hearing Disability Correlation Summary
| Measurement | Immigrants from Moldova | Cypriot |
| Minimum | 0.37% | 1.1% |
| Maximum | 9.5% | 12.5% |
| Range | 9.1% | 11.4% |
| Mean | 3.5% | 3.3% |
| Median | 3.1% | 3.0% |
| Interquartile 25% (IQ1) | 2.9% | 2.4% |
| Interquartile 75% (IQ3) | 3.8% | 3.7% |
| Interquartile Range (IQR) | 0.98% | 1.3% |
| Standard Deviation (Sample) | 1.7% | 1.9% |
| Standard Deviation (Population) | 1.7% | 1.9% |
Similar Demographics by Hearing Disability
Demographics Similar to Immigrants from Moldova by Hearing Disability
In terms of hearing disability, the demographic groups most similar to Immigrants from Moldova are Immigrants from Sweden (3.0%, a difference of 0.060%), Immigrants from Belgium (3.0%, a difference of 0.15%), Immigrants from Italy (3.0%, a difference of 0.18%), Japanese (3.0%, a difference of 0.28%), and Immigrants from Philippines (3.0%, a difference of 0.31%).
| Demographics | Rating | Rank | Hearing Disability |
| Armenians | 56.0 /100 | #172 | Average 3.0% |
| Immigrants | Serbia | 51.1 /100 | #173 | Average 3.0% |
| Indonesians | 50.0 /100 | #174 | Average 3.0% |
| Immigrants | Romania | 48.4 /100 | #175 | Average 3.0% |
| Panamanians | 47.0 /100 | #176 | Average 3.0% |
| Immigrants | Philippines | 46.4 /100 | #177 | Average 3.0% |
| Japanese | 46.0 /100 | #178 | Average 3.0% |
| Immigrants | Moldova | 43.1 /100 | #179 | Average 3.0% |
| Immigrants | Sweden | 42.4 /100 | #180 | Average 3.0% |
| Immigrants | Belgium | 41.5 /100 | #181 | Average 3.0% |
| Immigrants | Italy | 41.1 /100 | #182 | Average 3.0% |
| Bulgarians | 39.7 /100 | #183 | Fair 3.0% |
| Immigrants | Ireland | 37.4 /100 | #184 | Fair 3.0% |
| Immigrants | Southern Europe | 35.3 /100 | #185 | Fair 3.0% |
| Immigrants | Mexico | 34.9 /100 | #186 | Fair 3.0% |
Demographics Similar to Cypriots by Hearing Disability
In terms of hearing disability, the demographic groups most similar to Cypriots are Turkish (2.8%, a difference of 0.050%), Immigrants from Yemen (2.8%, a difference of 0.050%), Guatemalan (2.8%, a difference of 0.12%), U.S. Virgin Islander (2.8%, a difference of 0.12%), and Honduran (2.8%, a difference of 0.20%).
| Demographics | Rating | Rank | Hearing Disability |
| Immigrants | Indonesia | 94.7 /100 | #103 | Exceptional 2.8% |
| Burmese | 94.2 /100 | #104 | Exceptional 2.8% |
| Moroccans | 93.9 /100 | #105 | Exceptional 2.8% |
| Hondurans | 93.4 /100 | #106 | Exceptional 2.8% |
| Immigrants | Chile | 93.4 /100 | #107 | Exceptional 2.8% |
| Guatemalans | 93.2 /100 | #108 | Exceptional 2.8% |
| Turks | 93.0 /100 | #109 | Exceptional 2.8% |
| Cypriots | 92.9 /100 | #110 | Exceptional 2.8% |
| Immigrants | Yemen | 92.7 /100 | #111 | Exceptional 2.8% |
| U.S. Virgin Islanders | 92.5 /100 | #112 | Exceptional 2.8% |
| Immigrants | Belarus | 91.6 /100 | #113 | Exceptional 2.8% |
| Cambodians | 91.1 /100 | #114 | Exceptional 2.8% |
| Immigrants | Latin America | 90.5 /100 | #115 | Exceptional 2.8% |
| Immigrants | Immigrants | 90.3 /100 | #116 | Exceptional 2.8% |
| Immigrants | Liberia | 90.0 /100 | #117 | Excellent 2.8% |