Immigrants from Mexico vs Immigrants from Italy Disability Age 18 to 34

COMPARE

Immigrants from Mexico
Race
Ancestry
AfghanAfricanAlaska NativeAlaskan AthabascanAlbanianAleutAlsatianAmericanApacheArabArapahoArgentineanArmenianAssyrian/Chaldean/SyriacAustralianAustrianBahamianBangladeshiBarbadianBasqueBelgianBelizeanBermudanBhutaneseBlackfeetBolivianBrazilianBritishBritish West IndianBulgarianBurmeseCajunCambodianCanadianCape VerdeanCarpatho RusynCelticCentral AmericanCentral American IndianCherokeeCheyenneChickasawChileanChineseChippewaChoctawColombianColvilleComancheCosta RicanCreeCreekCroatianCrowCubanCypriotCzechCzechoslovakianDanishDelawareDominicanDutchDutch West IndianEastern EuropeanEcuadorianEgyptianEnglishEstonianEthiopianEuropeanFijianFilipinoFinnishFrenchFrench American IndianFrench CanadianGermanGerman RussianGhanaianGreekGuamanian/ChamorroGuatemalanGuyaneseHaitianHmongHonduranHopiHoumaHungarianIcelanderIndian (Asian)IndonesianInupiatIranianIraqiIrishIroquoisIsraeliItalianJamaicanJapaneseJordanianKenyanKiowaKoreanLaotianLatvianLebaneseLiberianLithuanianLumbeeLuxembourgerMacedonianMalaysianMalteseMarshalleseMenomineeMexicanMexican American IndianMongolianMoroccanNative HawaiianNavajoNepaleseNew ZealanderNicaraguanNigerianNorthern EuropeanNorwegianOkinawanOsageOttawaPaiutePakistaniPalestinianPanamanianParaguayanPennsylvania GermanPeruvianPimaPolishPortuguesePotawatomiPuebloPuerto RicanPuget Sound SalishRomanianRussianSalvadoranSamoanScandinavianScotch-IrishScottishSeminoleSenegaleseSerbianShoshoneSierra LeoneanSiouxSlavicSlovakSloveneSomaliSouth AfricanSouth AmericanSouth American IndianSoviet UnionSpaniardSpanishSpanish AmericanSpanish American IndianSri LankanSubsaharan AfricanSudaneseSwedishSwissSyrianTaiwaneseThaiTlingit-HaidaTohono O'OdhamTonganTrinidadian and TobagonianTsimshianTurkishU.S. Virgin IslanderUgandanUkrainianUruguayanUteVenezuelanVietnameseWelshWest IndianYakamaYaquiYugoslavianYumanYup'ikZimbabwean
Immigration
NonimmigrantsImmigrantsAfghanistanAfricaAlbaniaArgentinaArmeniaAsiaAustraliaAustriaBahamasBangladeshBarbadosBelarusBelgiumBelizeBoliviaBosnia and HerzegovinaBrazilBulgariaBurma/MyanmarCabo VerdeCambodiaCameroonCanadaCaribbeanCentral AmericaChileChinaColombiaCongoCosta RicaCroatiaCubaCzechoslovakiaDenmarkDominicaDominican RepublicEastern AfricaEastern AsiaEastern EuropeEcuadorEgyptEl SalvadorEnglandEritreaEthiopiaEuropeFijiFranceGermanyGhanaGreeceGrenadaGuatemalaGuyanaHaitiHondurasHong KongHungaryIndiaIndonesiaIranIraqIrelandIsraelJamaicaJapanJordanKazakhstanKenyaKoreaKuwaitLaosLatin AmericaLatviaLebanonLiberiaLithuaniaMalaysiaMexicoMicronesiaMiddle AfricaMoldovaMoroccoNepalNetherlandsNicaraguaNigeriaNorth AmericaNorth MacedoniaNorthern AfricaNorthern EuropeNorwayOceaniaPakistanPanamaPeruPhilippinesPolandPortugalRomaniaRussiaSaudi ArabiaScotlandSenegalSerbiaSierra LeoneSingaporeSomaliaSouth AfricaSouth AmericaSouth Central AsiaSouth Eastern AsiaSouthern EuropeSpainSri LankaSt. Vincent and the GrenadinesSudanSwedenSwitzerlandSyriaTaiwanThailandTrinidad and TobagoTurkeyUgandaUkraineUruguayUzbekistanVenezuelaVietnamWest IndiesWestern AfricaWestern AsiaWestern EuropeYemenZaireZimbabweAzores
Immigrants from Italy
Race
Ancestry
AfghanAfricanAlaska NativeAlaskan AthabascanAlbanianAleutAlsatianAmericanApacheArabArapahoArgentineanArmenianAssyrian/Chaldean/SyriacAustralianAustrianBahamianBangladeshiBarbadianBasqueBelgianBelizeanBermudanBhutaneseBlackfeetBolivianBrazilianBritishBritish West IndianBulgarianBurmeseCajunCambodianCanadianCape VerdeanCarpatho RusynCelticCentral AmericanCentral American IndianCherokeeCheyenneChickasawChileanChineseChippewaChoctawColombianColvilleComancheCosta RicanCreeCreekCroatianCrowCubanCypriotCzechCzechoslovakianDanishDelawareDominicanDutchDutch West IndianEastern EuropeanEcuadorianEgyptianEnglishEstonianEthiopianEuropeanFijianFilipinoFinnishFrenchFrench American IndianFrench CanadianGermanGerman RussianGhanaianGreekGuamanian/ChamorroGuatemalanGuyaneseHaitianHmongHonduranHopiHoumaHungarianIcelanderIndian (Asian)IndonesianInupiatIranianIraqiIrishIroquoisIsraeliItalianJamaicanJapaneseJordanianKenyanKiowaKoreanLaotianLatvianLebaneseLiberianLithuanianLumbeeLuxembourgerMacedonianMalaysianMalteseMarshalleseMenomineeMexicanMexican American IndianMongolianMoroccanNative HawaiianNavajoNepaleseNew ZealanderNicaraguanNigerianNorthern EuropeanNorwegianOkinawanOsageOttawaPaiutePakistaniPalestinianPanamanianParaguayanPennsylvania GermanPeruvianPimaPolishPortuguesePotawatomiPuebloPuerto RicanPuget Sound SalishRomanianRussianSalvadoranSamoanScandinavianScotch-IrishScottishSeminoleSenegaleseSerbianShoshoneSierra LeoneanSiouxSlavicSlovakSloveneSomaliSouth AfricanSouth AmericanSouth American IndianSoviet UnionSpaniardSpanishSpanish AmericanSpanish American IndianSri LankanSubsaharan AfricanSudaneseSwedishSwissSyrianTaiwaneseThaiTlingit-HaidaTohono O'OdhamTonganTrinidadian and TobagonianTsimshianTurkishU.S. Virgin IslanderUgandanUkrainianUruguayanUteVenezuelanVietnameseWelshWest IndianYakamaYaquiYugoslavianYumanYup'ikZimbabwean
Immigration
NonimmigrantsImmigrantsAfghanistanAfricaAlbaniaArgentinaArmeniaAsiaAustraliaAustriaBahamasBangladeshBarbadosBelarusBelgiumBelizeBoliviaBosnia and HerzegovinaBrazilBulgariaBurma/MyanmarCabo VerdeCambodiaCameroonCanadaCaribbeanCentral AmericaChileChinaColombiaCongoCosta RicaCroatiaCubaCzechoslovakiaDenmarkDominicaDominican RepublicEastern AfricaEastern AsiaEastern EuropeEcuadorEgyptEl SalvadorEnglandEritreaEthiopiaEuropeFijiFranceGermanyGhanaGreeceGrenadaGuatemalaGuyanaHaitiHondurasHong KongHungaryIndiaIndonesiaIranIraqIrelandIsraelItalyJamaicaJapanJordanKazakhstanKenyaKoreaKuwaitLaosLatin AmericaLatviaLebanonLiberiaLithuaniaMalaysiaMicronesiaMiddle AfricaMoldovaMoroccoNepalNetherlandsNicaraguaNigeriaNorth AmericaNorth MacedoniaNorthern AfricaNorthern EuropeNorwayOceaniaPakistanPanamaPeruPhilippinesPolandPortugalRomaniaRussiaSaudi ArabiaScotlandSenegalSerbiaSierra LeoneSingaporeSomaliaSouth AfricaSouth AmericaSouth Central AsiaSouth Eastern AsiaSouthern EuropeSpainSri LankaSt. Vincent and the GrenadinesSudanSwedenSwitzerlandSyriaTaiwanThailandTrinidad and TobagoTurkeyUgandaUkraineUruguayUzbekistanVenezuelaVietnamWest IndiesWestern AfricaWestern AsiaWestern EuropeYemenZaireZimbabweAzores
Disability Age 18 to 34
Income
Poverty
Unemployment
Labor Participation
Family Structure
Vehicle Availability
Education Level
Disability

Disability Age 18 to 34 Comparison

Immigrants from Mexico

Immigrants from Italy

Average
Exceptional
6.6%
DISABILITY AGE 18 TO 34
54.1/ 100
METRIC RATING
173rd/ 347
METRIC RANK
6.3%
DISABILITY AGE 18 TO 34
90.5/ 100
METRIC RATING
129th/ 347
METRIC RANK

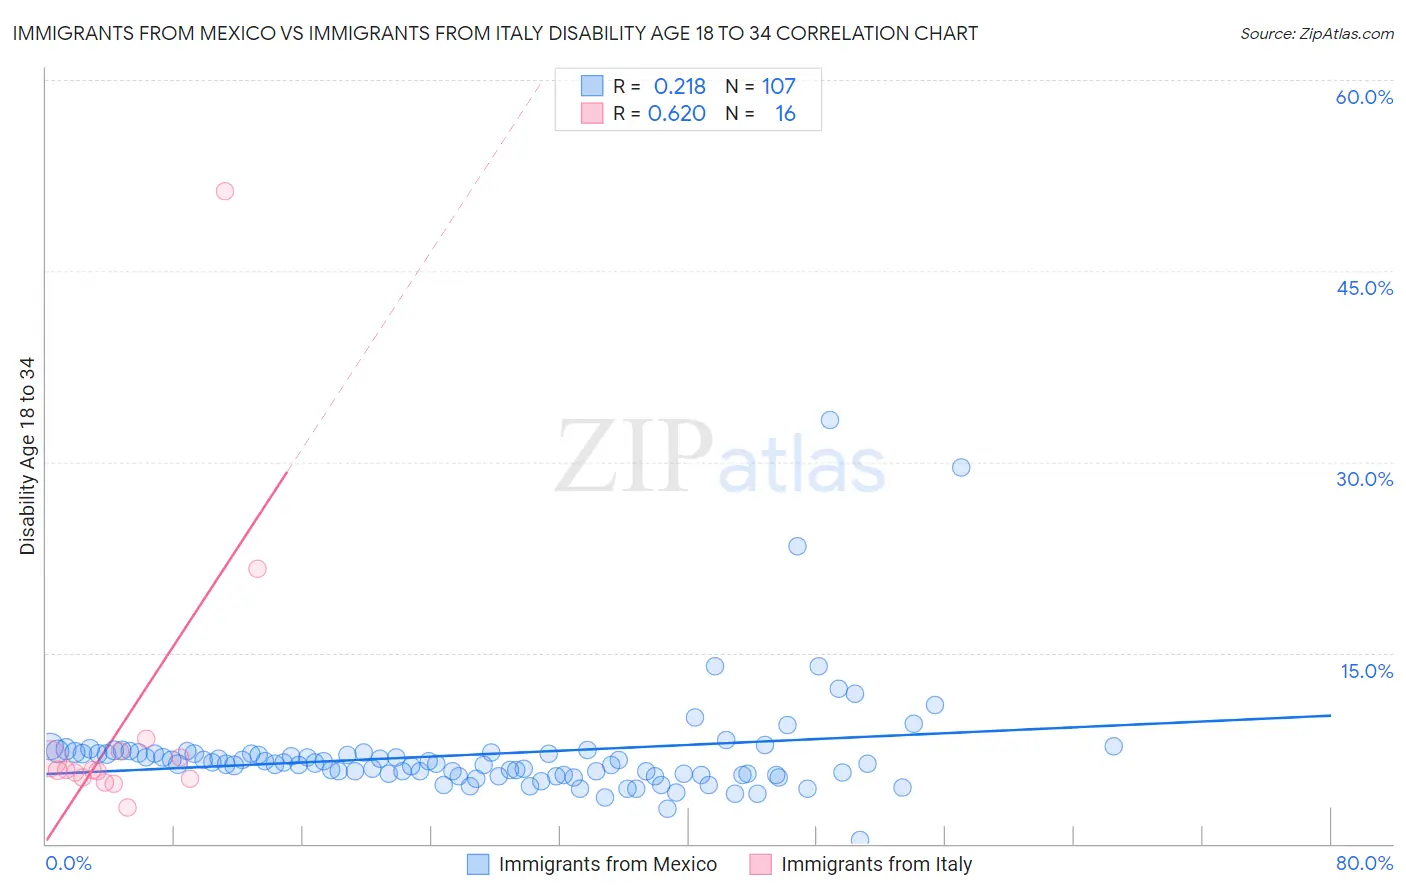
Immigrants from Mexico vs Immigrants from Italy Disability Age 18 to 34 Correlation Chart

The statistical analysis conducted on geographies consisting of 510,880,609 people shows a weak positive correlation between the proportion of Immigrants from Mexico and percentage of population with a disability between the ages 18 and 35 in the United States with a correlation coefficient (R) of 0.218 and weighted average of 6.6%. Similarly, the statistical analysis conducted on geographies consisting of 323,455,577 people shows a significant positive correlation between the proportion of Immigrants from Italy and percentage of population with a disability between the ages 18 and 35 in the United States with a correlation coefficient (R) of 0.620 and weighted average of 6.3%, a difference of 3.8%.
Immigrants from Mexico vs Immigrants from Italy Disability Age 18 to 34

Disability Age 18 to 34 Correlation Summary

MeasurementImmigrants from MexicoImmigrants from Italy
Minimum0.28%2.8%
Maximum33.3%51.2%
Range33.1%48.4%
Mean7.0%9.6%
Median6.3%5.8%
Interquartile 25% (IQ1)5.4%5.2%
Interquartile 75% (IQ3)7.1%7.0%
Interquartile Range (IQR)1.8%1.9%
Standard Deviation (Sample)4.2%11.8%
Standard Deviation (Population)4.2%11.5%

Similar Demographics by Disability Age 18 to 34

Demographics Similar to Immigrants from Mexico by Disability Age 18 to 34

In terms of disability age 18 to 34, the demographic groups most similar to Immigrants from Mexico are Ghanaian (6.6%, a difference of 0.040%), Bahamian (6.6%, a difference of 0.10%), Immigrants from Bahamas (6.6%, a difference of 0.27%), Native Hawaiian (6.6%, a difference of 0.29%), and Russian (6.5%, a difference of 0.44%).
DemographicsRating | RankDisability Age 18 to 34
Eastern Europeans
65.1
/100
|
#166
Good
6.5%
Immigrants | Northern Europe
64.1
/100
|
#167
Good
6.5%
Immigrants | Moldova
63.1
/100
|
#168
Good
6.5%
Russians
60.2
/100
|
#169
Good
6.5%
Immigrants | Bahamas
57.9
/100
|
#170
Average
6.6%
Bahamians
55.5
/100
|
#171
Average
6.6%
Ghanaians
54.7
/100
|
#172
Average
6.6%
Immigrants | Mexico
54.1
/100
|
#173
Average
6.6%
Native Hawaiians
50.0
/100
|
#174
Average
6.6%
Immigrants | Cambodia
46.5
/100
|
#175
Average
6.6%
Immigrants | Africa
45.9
/100
|
#176
Average
6.6%
Syrians
44.3
/100
|
#177
Average
6.6%
Nigerians
43.7
/100
|
#178
Average
6.6%
Immigrants | Ghana
42.1
/100
|
#179
Average
6.6%
Immigrants | Austria
39.6
/100
|
#180
Fair
6.6%

Demographics Similar to Immigrants from Italy by Disability Age 18 to 34

In terms of disability age 18 to 34, the demographic groups most similar to Immigrants from Italy are Immigrants from Dominica (6.3%, a difference of 0.010%), Immigrants from Saudi Arabia (6.3%, a difference of 0.020%), Guatemalan (6.4%, a difference of 0.19%), Chinese (6.3%, a difference of 0.31%), and Brazilian (6.4%, a difference of 0.31%).
DemographicsRating | RankDisability Age 18 to 34
Immigrants | Czechoslovakia
93.3
/100
|
#122
Exceptional
6.3%
Costa Ricans
92.9
/100
|
#123
Exceptional
6.3%
Immigrants | Morocco
92.9
/100
|
#124
Exceptional
6.3%
Macedonians
92.6
/100
|
#125
Exceptional
6.3%
Immigrants | Switzerland
92.5
/100
|
#126
Exceptional
6.3%
West Indians
92.0
/100
|
#127
Exceptional
6.3%
Chinese
91.9
/100
|
#128
Exceptional
6.3%
Immigrants | Italy
90.5
/100
|
#129
Exceptional
6.3%
Immigrants | Dominica
90.5
/100
|
#130
Exceptional
6.3%
Immigrants | Saudi Arabia
90.4
/100
|
#131
Exceptional
6.3%
Guatemalans
89.6
/100
|
#132
Excellent
6.4%
Brazilians
89.0
/100
|
#133
Excellent
6.4%
Immigrants | Europe
88.8
/100
|
#134
Excellent
6.4%
Palestinians
88.5
/100
|
#135
Excellent
6.4%
Immigrants | Sweden
88.5
/100
|
#136
Excellent
6.4%