Immigrants from Malaysia vs Estonian Male Disability
COMPARE
Immigrants from Malaysia
Estonian
Male Disability
Male Disability Comparison
Immigrants from Malaysia
Estonians
10.0%
MALE DISABILITY
99.9/ 100
METRIC RATING
25th/ 347
METRIC RANK
11.4%
MALE DISABILITY
26.8/ 100
METRIC RATING
188th/ 347
METRIC RANK
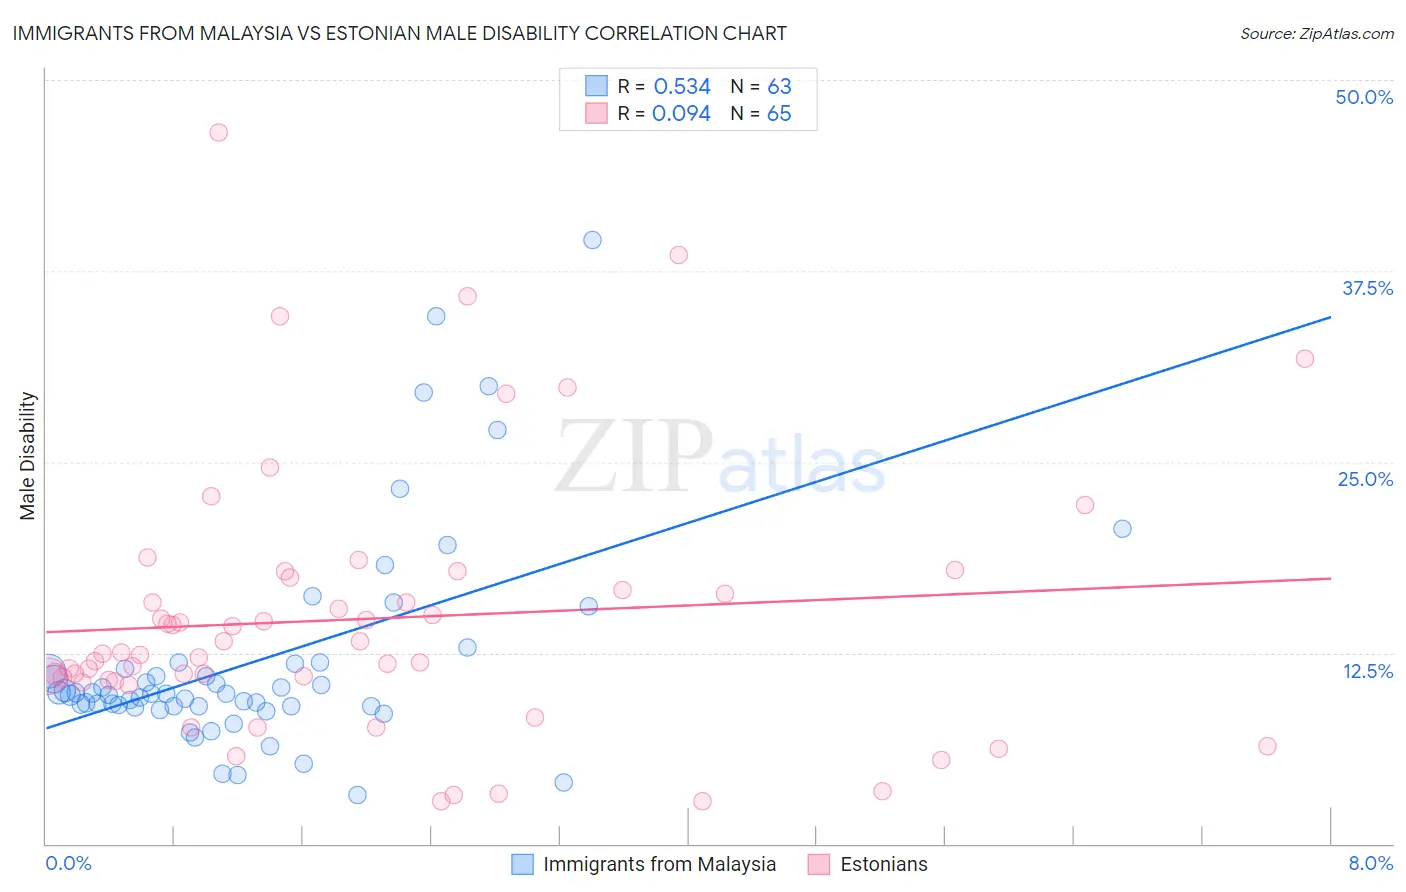
Immigrants from Malaysia vs Estonian Male Disability Correlation Chart
The statistical analysis conducted on geographies consisting of 197,973,709 people shows a substantial positive correlation between the proportion of Immigrants from Malaysia and percentage of males with a disability in the United States with a correlation coefficient (R) of 0.534 and weighted average of 10.0%. Similarly, the statistical analysis conducted on geographies consisting of 123,527,387 people shows a slight positive correlation between the proportion of Estonians and percentage of males with a disability in the United States with a correlation coefficient (R) of 0.094 and weighted average of 11.4%, a difference of 13.2%.
Male Disability Correlation Summary
| Measurement | Immigrants from Malaysia | Estonian |
| Minimum | 3.2% | 2.8% |
| Maximum | 39.6% | 46.6% |
| Range | 36.3% | 43.8% |
| Mean | 12.0% | 14.7% |
| Median | 9.8% | 12.5% |
| Interquartile 25% (IQ1) | 9.0% | 10.7% |
| Interquartile 75% (IQ3) | 11.8% | 17.0% |
| Interquartile Range (IQR) | 2.8% | 6.3% |
| Standard Deviation (Sample) | 7.1% | 8.7% |
| Standard Deviation (Population) | 7.0% | 8.7% |
Similar Demographics by Male Disability
Demographics Similar to Immigrants from Malaysia by Male Disability
In terms of male disability, the demographic groups most similar to Immigrants from Malaysia are Paraguayan (10.1%, a difference of 0.13%), Immigrants from Asia (10.0%, a difference of 0.19%), Cypriot (10.0%, a difference of 0.32%), Immigrants from Venezuela (10.0%, a difference of 0.41%), and Egyptian (10.1%, a difference of 0.45%).
| Demographics | Rating | Rank | Male Disability |
| Immigrants | Pakistan | 100.0 /100 | #18 | Exceptional 9.8% |
| Immigrants | Sri Lanka | 100.0 /100 | #19 | Exceptional 10.0% |
| Asians | 100.0 /100 | #20 | Exceptional 10.0% |
| Burmese | 100.0 /100 | #21 | Exceptional 10.0% |
| Immigrants | Venezuela | 100.0 /100 | #22 | Exceptional 10.0% |
| Cypriots | 100.0 /100 | #23 | Exceptional 10.0% |
| Immigrants | Asia | 100.0 /100 | #24 | Exceptional 10.0% |
| Immigrants | Malaysia | 99.9 /100 | #25 | Exceptional 10.0% |
| Paraguayans | 99.9 /100 | #26 | Exceptional 10.1% |
| Egyptians | 99.9 /100 | #27 | Exceptional 10.1% |
| Vietnamese | 99.9 /100 | #28 | Exceptional 10.1% |
| Venezuelans | 99.9 /100 | #29 | Exceptional 10.1% |
| Immigrants | Egypt | 99.9 /100 | #30 | Exceptional 10.1% |
| Soviet Union | 99.9 /100 | #31 | Exceptional 10.1% |
| Argentineans | 99.9 /100 | #32 | Exceptional 10.1% |
Demographics Similar to Estonians by Male Disability
In terms of male disability, the demographic groups most similar to Estonians are Immigrants from Austria (11.4%, a difference of 0.040%), Immigrants from Zaire (11.4%, a difference of 0.060%), Immigrants from Netherlands (11.4%, a difference of 0.060%), Immigrants from Bosnia and Herzegovina (11.4%, a difference of 0.10%), and Pakistani (11.3%, a difference of 0.24%).
| Demographics | Rating | Rank | Male Disability |
| Immigrants | Senegal | 34.4 /100 | #181 | Fair 11.3% |
| Immigrants | Belize | 33.7 /100 | #182 | Fair 11.3% |
| Immigrants | Central America | 32.9 /100 | #183 | Fair 11.3% |
| Iraqis | 30.5 /100 | #184 | Fair 11.3% |
| Pakistanis | 30.3 /100 | #185 | Fair 11.3% |
| Immigrants | Zaire | 27.6 /100 | #186 | Fair 11.4% |
| Immigrants | Austria | 27.3 /100 | #187 | Fair 11.4% |
| Estonians | 26.8 /100 | #188 | Fair 11.4% |
| Immigrants | Netherlands | 25.9 /100 | #189 | Fair 11.4% |
| Immigrants | Bosnia and Herzegovina | 25.4 /100 | #190 | Fair 11.4% |
| Senegalese | 23.2 /100 | #191 | Fair 11.4% |
| Assyrians/Chaldeans/Syriacs | 23.2 /100 | #192 | Fair 11.4% |
| Greeks | 22.2 /100 | #193 | Fair 11.4% |
| Belizeans | 21.2 /100 | #194 | Fair 11.4% |
| Immigrants | Oceania | 20.9 /100 | #195 | Fair 11.4% |