Immigrants from Liberia vs Immigrants from Costa Rica Disability Age Over 75

COMPARE

Immigrants from Liberia
Race
Ancestry
AfghanAfricanAlaska NativeAlaskan AthabascanAlbanianAleutAlsatianAmericanApacheArabArapahoArgentineanArmenianAssyrian/Chaldean/SyriacAustralianAustrianBahamianBangladeshiBarbadianBasqueBelgianBelizeanBermudanBhutaneseBlackfeetBolivianBrazilianBritishBritish West IndianBulgarianBurmeseCajunCambodianCanadianCape VerdeanCarpatho RusynCelticCentral AmericanCentral American IndianCherokeeCheyenneChickasawChileanChineseChippewaChoctawColombianColvilleComancheCosta RicanCreeCreekCroatianCrowCubanCypriotCzechCzechoslovakianDanishDelawareDominicanDutchDutch West IndianEastern EuropeanEcuadorianEgyptianEnglishEstonianEthiopianEuropeanFijianFilipinoFinnishFrenchFrench American IndianFrench CanadianGermanGerman RussianGhanaianGreekGuamanian/ChamorroGuatemalanGuyaneseHaitianHmongHonduranHopiHoumaHungarianIcelanderIndian (Asian)IndonesianInupiatIranianIraqiIrishIroquoisIsraeliItalianJamaicanJapaneseJordanianKenyanKiowaKoreanLaotianLatvianLebaneseLiberianLithuanianLumbeeLuxembourgerMacedonianMalaysianMalteseMarshalleseMenomineeMexicanMexican American IndianMongolianMoroccanNative HawaiianNavajoNepaleseNew ZealanderNicaraguanNigerianNorthern EuropeanNorwegianOkinawanOsageOttawaPaiutePakistaniPalestinianPanamanianParaguayanPennsylvania GermanPeruvianPimaPolishPortuguesePotawatomiPuebloPuerto RicanPuget Sound SalishRomanianRussianSalvadoranSamoanScandinavianScotch-IrishScottishSeminoleSenegaleseSerbianShoshoneSierra LeoneanSiouxSlavicSlovakSloveneSomaliSouth AfricanSouth AmericanSouth American IndianSoviet UnionSpaniardSpanishSpanish AmericanSpanish American IndianSri LankanSubsaharan AfricanSudaneseSwedishSwissSyrianTaiwaneseThaiTlingit-HaidaTohono O'OdhamTonganTrinidadian and TobagonianTsimshianTurkishU.S. Virgin IslanderUgandanUkrainianUruguayanUteVenezuelanVietnameseWelshWest IndianYakamaYaquiYugoslavianYumanYup'ikZimbabwean
Immigration
NonimmigrantsImmigrantsAfghanistanAfricaAlbaniaArgentinaArmeniaAsiaAustraliaAustriaBahamasBangladeshBarbadosBelarusBelgiumBelizeBoliviaBosnia and HerzegovinaBrazilBulgariaBurma/MyanmarCabo VerdeCambodiaCameroonCanadaCaribbeanCentral AmericaChileChinaColombiaCongoCroatiaCubaCzechoslovakiaDenmarkDominicaDominican RepublicEastern AfricaEastern AsiaEastern EuropeEcuadorEgyptEl SalvadorEnglandEritreaEthiopiaEuropeFijiFranceGermanyGhanaGreeceGrenadaGuatemalaGuyanaHaitiHondurasHong KongHungaryIndiaIndonesiaIranIraqIrelandIsraelItalyJamaicaJapanJordanKazakhstanKenyaKoreaKuwaitLaosLatin AmericaLatviaLebanonLiberiaLithuaniaMalaysiaMexicoMicronesiaMiddle AfricaMoldovaMoroccoNepalNetherlandsNicaraguaNigeriaNorth AmericaNorth MacedoniaNorthern AfricaNorthern EuropeNorwayOceaniaPakistanPanamaPeruPhilippinesPolandPortugalRomaniaRussiaSaudi ArabiaScotlandSenegalSerbiaSierra LeoneSingaporeSomaliaSouth AfricaSouth AmericaSouth Central AsiaSouth Eastern AsiaSouthern EuropeSpainSri LankaSt. Vincent and the GrenadinesSudanSwedenSwitzerlandSyriaTaiwanThailandTrinidad and TobagoTurkeyUgandaUkraineUruguayUzbekistanVenezuelaVietnamWest IndiesWestern AfricaWestern AsiaWestern EuropeYemenZaireZimbabweAzores
Immigrants from Costa Rica
Race
Ancestry
AfghanAfricanAlaska NativeAlaskan AthabascanAlbanianAleutAlsatianAmericanApacheArabArapahoArgentineanArmenianAssyrian/Chaldean/SyriacAustralianAustrianBahamianBangladeshiBarbadianBasqueBelgianBelizeanBermudanBhutaneseBlackfeetBolivianBrazilianBritishBritish West IndianBulgarianBurmeseCajunCambodianCanadianCape VerdeanCarpatho RusynCelticCentral AmericanCentral American IndianCherokeeCheyenneChickasawChileanChineseChippewaChoctawColombianColvilleComancheCosta RicanCreeCreekCroatianCrowCubanCypriotCzechCzechoslovakianDanishDelawareDominicanDutchDutch West IndianEastern EuropeanEcuadorianEgyptianEnglishEstonianEthiopianEuropeanFijianFilipinoFinnishFrenchFrench American IndianFrench CanadianGermanGerman RussianGhanaianGreekGuamanian/ChamorroGuatemalanGuyaneseHaitianHmongHonduranHopiHoumaHungarianIcelanderIndian (Asian)IndonesianInupiatIranianIraqiIrishIroquoisIsraeliItalianJamaicanJapaneseJordanianKenyanKiowaKoreanLaotianLatvianLebaneseLiberianLithuanianLumbeeLuxembourgerMacedonianMalaysianMalteseMarshalleseMenomineeMexicanMexican American IndianMongolianMoroccanNative HawaiianNavajoNepaleseNew ZealanderNicaraguanNigerianNorthern EuropeanNorwegianOkinawanOsageOttawaPaiutePakistaniPalestinianPanamanianParaguayanPennsylvania GermanPeruvianPimaPolishPortuguesePotawatomiPuebloPuerto RicanPuget Sound SalishRomanianRussianSalvadoranSamoanScandinavianScotch-IrishScottishSeminoleSenegaleseSerbianShoshoneSierra LeoneanSiouxSlavicSlovakSloveneSomaliSouth AfricanSouth AmericanSouth American IndianSoviet UnionSpaniardSpanishSpanish AmericanSpanish American IndianSri LankanSubsaharan AfricanSudaneseSwedishSwissSyrianTaiwaneseThaiTlingit-HaidaTohono O'OdhamTonganTrinidadian and TobagonianTsimshianTurkishU.S. Virgin IslanderUgandanUkrainianUruguayanUteVenezuelanVietnameseWelshWest IndianYakamaYaquiYugoslavianYumanYup'ikZimbabwean
Immigration
NonimmigrantsImmigrantsAfghanistanAfricaAlbaniaArgentinaArmeniaAsiaAustraliaAustriaBahamasBangladeshBarbadosBelarusBelgiumBelizeBoliviaBosnia and HerzegovinaBrazilBulgariaBurma/MyanmarCabo VerdeCambodiaCameroonCanadaCaribbeanCentral AmericaChileChinaColombiaCongoCosta RicaCroatiaCubaCzechoslovakiaDenmarkDominicaDominican RepublicEastern AfricaEastern AsiaEastern EuropeEcuadorEgyptEl SalvadorEnglandEritreaEthiopiaEuropeFijiFranceGermanyGhanaGreeceGrenadaGuatemalaGuyanaHaitiHondurasHong KongHungaryIndiaIndonesiaIranIraqIrelandIsraelItalyJamaicaJapanJordanKazakhstanKenyaKoreaKuwaitLaosLatin AmericaLatviaLebanonLithuaniaMalaysiaMexicoMicronesiaMiddle AfricaMoldovaMoroccoNepalNetherlandsNicaraguaNigeriaNorth AmericaNorth MacedoniaNorthern AfricaNorthern EuropeNorwayOceaniaPakistanPanamaPeruPhilippinesPolandPortugalRomaniaRussiaSaudi ArabiaScotlandSenegalSerbiaSierra LeoneSingaporeSomaliaSouth AfricaSouth AmericaSouth Central AsiaSouth Eastern AsiaSouthern EuropeSpainSri LankaSt. Vincent and the GrenadinesSudanSwedenSwitzerlandSyriaTaiwanThailandTrinidad and TobagoTurkeyUgandaUkraineUruguayUzbekistanVenezuelaVietnamWest IndiesWestern AfricaWestern AsiaWestern EuropeYemenZaireZimbabweAzores
Disability Age Over 75
Income
Poverty
Unemployment
Labor Participation
Family Structure
Vehicle Availability
Education Level
Disability

Disability Age Over 75 Comparison

Immigrants from Liberia

Immigrants from Costa Rica

Tragic
Excellent
48.1%
DISABILITY AGE OVER 75
5.9/ 100
METRIC RATING
228th/ 347
METRIC RANK
46.8%
DISABILITY AGE OVER 75
87.4/ 100
METRIC RATING
140th/ 347
METRIC RANK

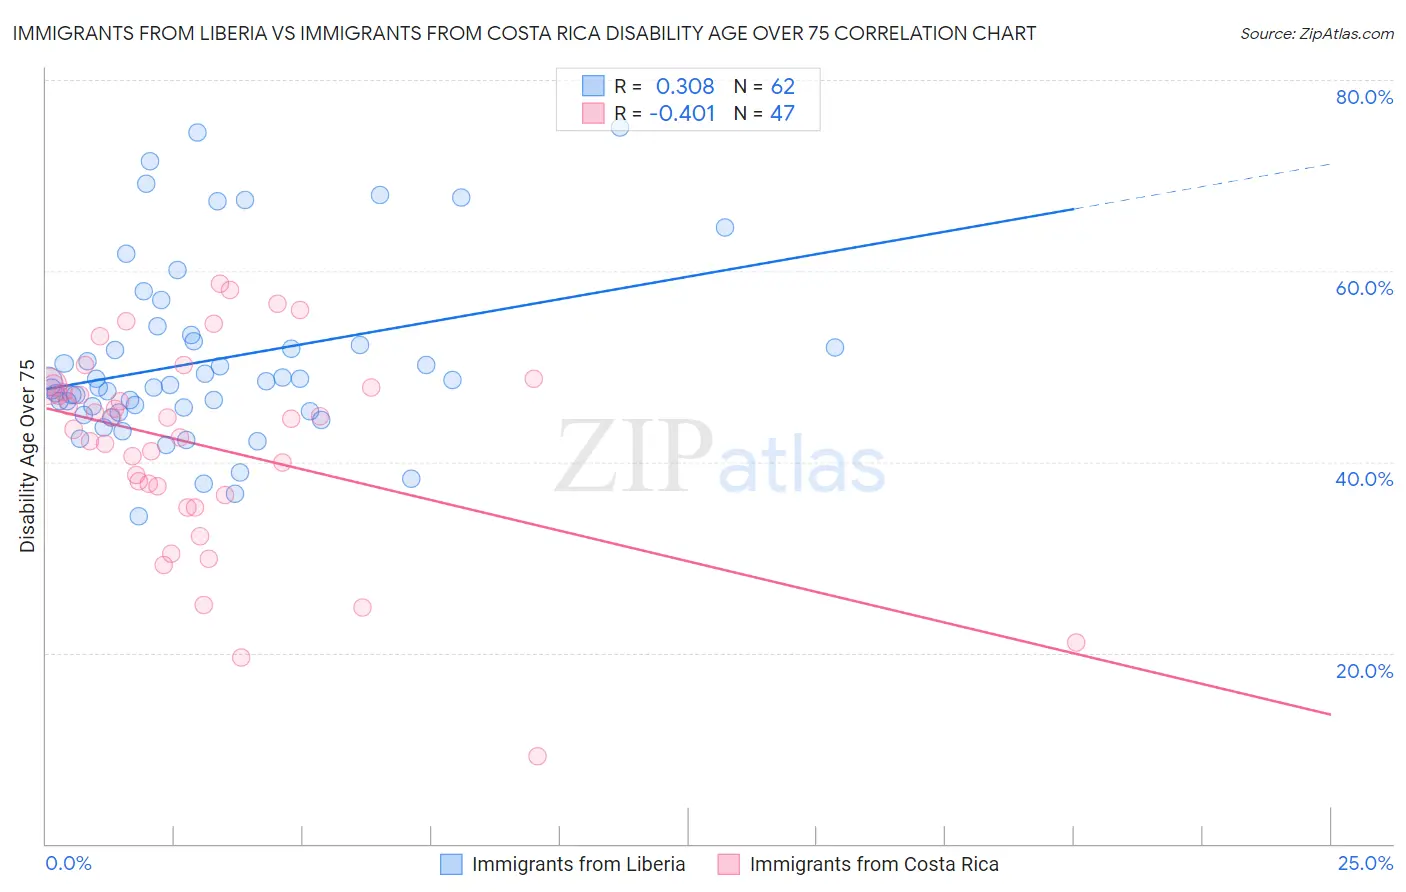
Immigrants from Liberia vs Immigrants from Costa Rica Disability Age Over 75 Correlation Chart

The statistical analysis conducted on geographies consisting of 135,085,224 people shows a mild positive correlation between the proportion of Immigrants from Liberia and percentage of population with a disability over the age of 75 in the United States with a correlation coefficient (R) of 0.308 and weighted average of 48.1%. Similarly, the statistical analysis conducted on geographies consisting of 204,226,316 people shows a moderate negative correlation between the proportion of Immigrants from Costa Rica and percentage of population with a disability over the age of 75 in the United States with a correlation coefficient (R) of -0.401 and weighted average of 46.8%, a difference of 2.7%.
Immigrants from Liberia vs Immigrants from Costa Rica Disability Age Over 75

Disability Age Over 75 Correlation Summary

MeasurementImmigrants from LiberiaImmigrants from Costa Rica
Minimum34.4%9.1%
Maximum75.1%58.7%
Range40.7%49.6%
Mean50.7%41.7%
Median48.2%44.5%
Interquartile 25% (IQ1)45.3%36.5%
Interquartile 75% (IQ3)52.7%48.0%
Interquartile Range (IQR)7.4%11.5%
Standard Deviation (Sample)9.4%10.6%
Standard Deviation (Population)9.3%10.5%

Similar Demographics by Disability Age Over 75

Demographics Similar to Immigrants from Liberia by Disability Age Over 75

In terms of disability age over 75, the demographic groups most similar to Immigrants from Liberia are Spaniard (48.1%, a difference of 0.020%), Zimbabwean (48.1%, a difference of 0.040%), Nonimmigrants (48.0%, a difference of 0.050%), Spanish (48.0%, a difference of 0.060%), and Liberian (48.0%, a difference of 0.070%).
DemographicsRating | RankDisability Age Over 75
Immigrants | Oceania
7.3
/100
|
#221
Tragic
48.0%
Barbadians
6.8
/100
|
#222
Tragic
48.0%
Immigrants | Bangladesh
6.8
/100
|
#223
Tragic
48.0%
Liberians
6.7
/100
|
#224
Tragic
48.0%
Spanish
6.5
/100
|
#225
Tragic
48.0%
Immigrants | Nonimmigrants
6.5
/100
|
#226
Tragic
48.0%
Zimbabweans
6.4
/100
|
#227
Tragic
48.1%
Immigrants | Liberia
5.9
/100
|
#228
Tragic
48.1%
Spaniards
5.7
/100
|
#229
Tragic
48.1%
Taiwanese
4.4
/100
|
#230
Tragic
48.2%
Immigrants | Immigrants
4.3
/100
|
#231
Tragic
48.2%
Indonesians
4.2
/100
|
#232
Tragic
48.2%
Cree
4.2
/100
|
#233
Tragic
48.2%
Sub-Saharan Africans
3.8
/100
|
#234
Tragic
48.2%
Hmong
3.8
/100
|
#235
Tragic
48.2%

Demographics Similar to Immigrants from Costa Rica by Disability Age Over 75

In terms of disability age over 75, the demographic groups most similar to Immigrants from Costa Rica are Lebanese (46.8%, a difference of 0.020%), Immigrants from Bosnia and Herzegovina (46.8%, a difference of 0.050%), Yugoslavian (46.8%, a difference of 0.050%), Peruvian (46.8%, a difference of 0.050%), and Immigrants from Venezuela (46.8%, a difference of 0.060%).
DemographicsRating | RankDisability Age Over 75
English
89.4
/100
|
#133
Excellent
46.8%
Immigrants | Ethiopia
89.1
/100
|
#134
Excellent
46.8%
Ethiopians
88.9
/100
|
#135
Excellent
46.8%
Immigrants | Venezuela
88.6
/100
|
#136
Excellent
46.8%
Immigrants | Uganda
88.5
/100
|
#137
Excellent
46.8%
Immigrants | Bosnia and Herzegovina
88.5
/100
|
#138
Excellent
46.8%
Yugoslavians
88.5
/100
|
#139
Excellent
46.8%
Immigrants | Costa Rica
87.4
/100
|
#140
Excellent
46.8%
Lebanese
87.0
/100
|
#141
Excellent
46.8%
Peruvians
86.5
/100
|
#142
Excellent
46.8%
Bermudans
85.6
/100
|
#143
Excellent
46.9%
Venezuelans
85.0
/100
|
#144
Excellent
46.9%
Costa Ricans
84.5
/100
|
#145
Excellent
46.9%
Guyanese
84.3
/100
|
#146
Excellent
46.9%
Immigrants | Peru
84.1
/100
|
#147
Excellent
46.9%